| Home | AmMin | GMR | RiMG | Collectors Corner | Directory | Short Courses | |
|
|
|||||||

|
|
Volume 73, pages 313-323, 1988 Origin and significance of blue coloration in quartz from Llano rhyolite (llanite), north-central Llano County, Texas
MICHAEL E. ZOLENSKY
PAUL J. SYLVESTER*
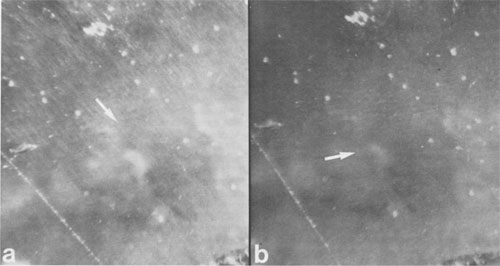
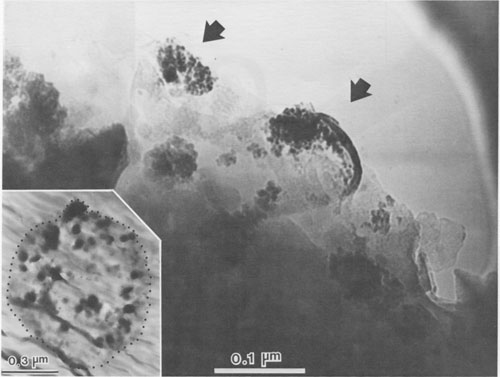
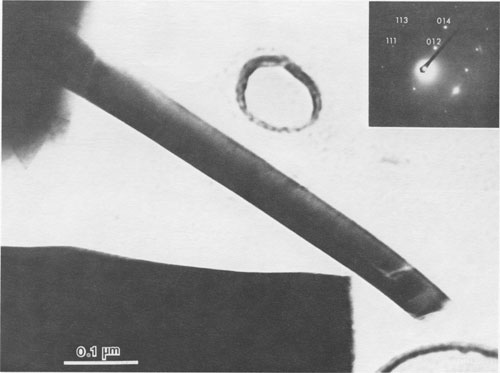
JAMES B. PACES ABSTRACT Blue quartz phenocrysts from the Llano rhyolite (Ilanite), Llano County, Texas, derive their coloration from Rayleigh scattering by abundant submicrometer-sized (type 1) ilmenite inclusions. Also included are larger, less abundant ribbon-shaped (type 2) ilmenite inclusions lying on the rhombohedral growth surfaces of the host quartz. These type 2 inclusions produce chatoyance in certain orientations; however, they are, in general, individually too large (~0.1 by 1 by 20 μm) to contribute to the blue color by Rayleigh scattering. The total amount of ilmenite in the Ilanite blue quartz is calculated to be ~0.02 vol%. Llanite blue quartz and groundmass exhibit distinct trace-element crystal/liquid partition coefficients that deviate from the flat patterns characteristic of other quartz/rhyolite pairs. Partition coefficients for Hf (0.335), Zr (0.38), Cr (0.10), and Lu (0.28) are significantly greater than those for Rb (0.01), Ba (0.0 13), Th (0.004), La (0.003), and Tb (0.008), suggesting that a majority of the ilmenite inclusions crystallized from the llanite melt. This conclusion assumes that quartz equally partitions all elements except Eu, which in the llanite blue quartz as well as some colorless quartz exhibits partition coefficients with a positive anomaly (Eu/Eu* > 2.6). The trace-element data are compatible with either of the following scenarios: (1) both type 1 and type 2 ilmenite inclusions originated by crystallization from the llanite magma, or (2) the volumetrically major portion of the ilmenite inclusions (probably type 1) was derived by crystallization from the magma, whereas the remainder (probably only type 2) was formed by exsolution processes. If entrapment of early crystallizing ilmenite is a generally applicable model for the origin of blue quartz, two implications arise. First, calibrations of the temperature and oxygen fugacity of Fe-Ti oxide exsolution in blue quartz should not be made unless an exsolution origin for the inclusions is assured. Second, the dominant occurrence of blue quartz in rocks of middle to late Proterozoic age may reflect preferential conditions that promoted early ilmenite saturation during this time. These conditions remain largely undetermined but could involve particular physical parameters of magma equilibrium such as low temperature, high pressure, or high oxygen fugacity and/or processes of magma production resulting in Ti-, Fe-, alkali-, and REE-rich high-silica compositions. INTRODUCTION Quartz crystals exhibiting blue coloration are encountered variously in granites, granodiorites, rhyolites, charnockites, as silicic segregations within anorthosites, and in the regionally metamorphosed products of all these rocks (cf., DeLong and Long, 1976; Herz and Force, 1984; Clarke, 1984; McConnell and Costello, 1984). With few exceptions (Shaw and Flood, 1981), blue quartz is restricted in occurrence to rocks of Precambrian, and particularly middle to late Proterozoic age. The Proterozoic occurrence of blue quartz as crystals is in contrast to bluish to gray cryptocrystalline silica, which is unconstrained in age, and with which this paper is unconcerned. The origin of blue coloration in quartz crystals has long been known to result from the scattering of light. Several mechanisms have the potential to cause this scattering. Two less-cited mechanisms, strain deformation and Rayleigh scattering from fluid inclusions, have been proposed as the agent for blue coloration for several occurrences (e.g., Milford granite, Emerson and Perry, 1907). However, in the majority of instances, blue coloration in quartz is believed to arise by Rayleigh scattering from submicrometer-sized solid mineral inclusions (e.g., Robertson, 1885; Iddings, 1904; Jayaraman, 1939). The literature concerning the identity of the included phases is enormous, and only the more conclusive (and contradictory) studies will be summarized. The blue quartzes of the Roseland district, Virginia, have been examined by Robertson (1884, 1885) and, a century later, by Nord (cited in Herz and Force, 1984), who attributed the coloration to Rayleigh scattering from submicrometer-sized crystals of an iron-titanium oxide (probably ilmenite). In the course of an examination of the same material, Watson and Beard (1917) concluded that the coloration was due to crystals of rutile. Indeed, most early workers concluded (assumed?) that rutile was the cause of blue coloration in quartz (Robertson, 1885; Postelmann, 1937; Jayaraman, 1939), and this view was promulgated by later authorities (Goldschmidt, 1954; Frondel, 1962). Nevertheless, Parker (1962) described inclusions of tourmaline within blue quartz from the Wind River Range, Wyoming. An unusual controversy surrounds blue quartz from Llano County, Texas. In the initial report of this occurrence, Iddings (1904) concluded that the blue coloration in this material was probably due to apatite and also possibly ilmenite. Later workers, apparently misreading Idding's paper, stated that he reported rutile (e.g., Jayaraman, 1939). Finally, in a recent re-examination of the Llano material, Barker and Burmester (1970) concluded that the blue coloration was due to zircon! This lack of consensus on the included mineral occurred largely because the identification of microscopic to submicroscopic inclusion grains was frequently made by visual observation, rather than by modern analytical techniques. However, it is also probable that all blue quartzes do not contain the same mineral inclusions. Another uncertainty is the mechanism by which the included phase in blue quartz was produced. Several workers (Niggli and Thompson, 1979; G. L. Nord, Jr., cited in Herz and Force, 1984, and pers. comm., 1986; J. B. Thompson, pers. comm., 1986) have speculated that the inclusions in blue quartzes found in metamorphosed terranes may be a high-temperature exsolution feature, implying that blue quartzes are a potential geothermometer-oxygen barometer for metamorphic conditions. Niggli and Thompson (1979) also noted that blue quartz is highly strained in most occurrences, suggesting that the deformation of the quartz may promote the presumed exsolution process. A magmatic origin for the inclusions in blue quartzes is also possible - i.e., the inclusions may be a liquidus mineral phase subsequently entrapped in the growing quartz crystal. Thus, for most blue quartzes, there are at least three outstanding questions: (1) What mineral(s) forms the inclusions? (2) Did this mineral crystallize from a magmatic liquid or exsolve during subsolidus cooling, metamorphic heating, or deformation? (3) And why is blue quartz largely restricted in occurrence to Proterozoic and older rocks? In this paper, we attempt to answer the first two of these questions for the notable doubly terminated blue quartz phenocrysts from the Llano rhyolite, from Llano County, Texas, locally called "llanite" (Iddings, 1904). Llanite is a late Proterozoic, porphyritic, hypabyssal rhyolite intrusion within the Llano uplift of central Texas. The igneous minerals of this rhyolite are well preserved, although petrofabric data (Clabaugh and McGehee, 1963) and evidence of Rb-Sr redistribution (DeLong and Long, 1976) suggest that the rock has been affected by low-grade metamorphism. The blue quartz from this material exhibits a particularly beautiful blue coloration, which is sky-blue in the center of each crystal and darker at the margins (Iddings, 1904). In addition, in certain orientations these crystals display an intense silver-blue chatoyant flash. The results of our study of llanite may be applicable to the origin of blue quartz in other felsic rocks, particularly those that have suffered only low-grade metamorphism. In this regard, we then attempt to answer the third out standing question concerning the temporal association of blue quartz, as posed above. EXPERIMENTAL PROCEDURE Blue quartz phenocrysts were hand-picked from a partly weathered outcrop of Llano rhyolite located in a roadcut on the east side of Texas State Highway 16 (lat 30°53'22" N, long 98°39'23" W), approximately 17 km north of the Llano metropolitan area. Several fresh whole-rock specimens were also collected. The quartz phenocrysts were ground slightly in an alumina shatter box: and ultrapure (>99%) blue quartz separate was extracted from this mixture by hand-picking under a binocular microscope. Millimeter-sized chips of llanite microcline phenocrysts and matrix material were separated from the whole-rock samples by hand. The matrix chips were examined under a binocular microscope, and those with quartz or microcline phenocryst adhesions were rejected from the separate. The microcline was ground and then purified by magnetic separation and further hand-picking. A standard doubly polished petrographic thin section was also made from the whole-rock sample. Several thin chips of the blue quartz phenocrysts were mounted directly onto Be grids for observation in a JEOL 100cx scanning transmission electron microscope (STEM). Six other chips of blue quartz phenocrysts were set into epoxy and thin-sectioned using a Porter Blum MT-2 Ultra-Microtome and then subjected to STEM analysis. Unfortunately, these sections averaged approximately 400 Å thick, which was thicker than desired, because of the high hardness of quartz relative to that of the enclosing epoxy, but were still serviceable. All mineral identifications were verified using electron diffraction (ED). The diffraction data were calibrated by employing TIC powder on the specimen grids and are considered precise to within 5%. Additional quartz grains were digested in 1 M HF and then heated; the residue was examined in a JEOL 35C scanning electron microscope (SEM) and the STEM. Energy-dispersive spectroscopy (EDS) analyses were obtained of all material examined by electron microscopy using Princeton Gamma Tech thin-window and windowless detectors and analyzers attached to both the STEM and SEM. Approximately 200 mg of the blue quartz separate, 100 mg of the microcline separate, and 40 mg of the matrix separate were analyzed for Fe, Na, and trace elements by instrumental neutron activation analysis (INAA), following the procedures of Jacobs et al. (1977). Most of these elements have been determined to better than ±5%; the errors are <10% for Rb and Th, <25% for Cr, Ba, and Cs, and <50% for Sr, Zr, and U. Spectra were collected from the blue quartz in two separate Ge(Li) detectors as a check for consistency; counting times ranged from 20 to 24 h.The FeO t (= total Fe expressed as FeO) and TiO2 contents of the blue quartz phenocrysts were also analyzed using an automated Cameca CAMEBAX scanning electron microprobe. The instrument accelerating voltage was 15 kV, the beam current was 30 nA, and the beam diameter was 20 µm. Standard Cameca instrument and data-reduction software, which corrects X-ray intensities for dead time, background, and ZAF matrix effects, was employed. Ilmenite mineral standards were used. Counting times on element peak positions were 100 s, and background counts were 60 s. The precision of these analyses is no better than ±50%, owing to the very low Fe and Ti concentrations in the blue quartz. Microprobe analyses of groundmass ilmenite and magnetite were made by using the same procedures, except that the electron beam was focused to about 1-μm diameter and peak-position counting times ranged from 30 to 40 s. Natural mineral standards were used. These analyses are considered precise to within ±0.5%, because of the much higher concentrations and very low instrument drift.RESULTS Petrographic examination Llanite is a predominantly gray porphyry with abundant phenocrysts of reddish microcline microperthite (Or 66.1Ab29.4An4.5, Barker and Burmester, 1970) and blue quartz. The microcline phenocrysts are as much as 10 mm in diameter, and the quartz phenocrysts attain half this size. The groundmass is holocrystalline and microcrystalline and is composed of microcline, quartz, biotite, magnetite, ilmenite, fluorite, apatite, and zircon.The quartz phenocrysts are doubly terminated, consisting of a combination of positive and negative rhombohedrons with no obvious prisms, yielding a quartzoid. These crystals are blue only in reflected light, being reddish in transmitted light. This indicates that the blue coloration is due to Rayleigh scattering (Nassau, 1983) from submicrometer-sized grains suspended within the quartz (herein called type 1 inclusions). Another obvious feature of llanite blue quartz (but not a general characteristic of all blue quartz) is chatoyance, called "opalescence" by earlier llanite investigators (Iddings, 1904). This phenomenon is manifested by a bright blue-white flash observable in certain orientations. In reflected light this chatoyance is seen to arise from planes of oriented capillary or bladed inclusions (herein called type 2 inclusions) which, when viewed down the quartz c axis, intersect at angles that are multiples of 60° (see Fig. 1). These oriented inclusions are probably lying on rhombohedral growth surfaces of the quartz crystals. These type 2 inclusions measure approximately 1 µm across and up to 100 µm in length, although the length of an individual inclusion is difficult to judge. Since the production of blue coloration via Rayleigh scattering occurs only from inclusions measuring no more than ~0.3 µm in largest dimension (Nassau, 1983), the type 2 inclusions are not blue coloring agents. Electron-beam analyses STEM analyses of electron-transparent flakes of the blue quartz revealed the presence of ubiquitous, rounded, polycrystalline inclusions averaging ~0.06 µm in diameter (see Fig. 2). Semiquantitative EDS analyses showed the presence of major Fe and Ti, with minor Si and trace Mn (attributed to the host quartz). ED analysis of these inclusions revealed them to be ilmenite. The most frequently encountered diffraction reflections observed were at 3.74(19) (012), 2.76(14) (104), and 2.24(11) Å (113). Ilmenite diffraction reflections measuring 2.55(13) (110), 2.11(11) (202), 1.87(9) (024), and 1.65(8) Å (211) were less commonly encountered. These ilmenite grains are the smaller type 1 inclusions noted in the optical examination. STEM imaging of ultrathin sections of blue quartz produced by the ultramicrotome (one section is shown as an inset in Fig. 2) allowed larger regions of quartz grains to be observed in transmission than was permitted by the previously described fractured samples. The only mineral inclusions observed within these ultramicrotomed quartz sections were the type 1 ilmenites. The spatial density of the type 1 ilmenite inclusions was observed to vary considerably, up to ~125 inclusions per cubic micrometer. Larger ribbon-shaped crystals of ilmenite (identified by ED) were encountered during observation of the fractured blue quartz, although with considerably lower frequency than the type 1 ilmenite inclusions (see Fig. 3). Semiquantitative chemistry of these inclusions is also compatible with ilmenite. These ribbon-shaped crystals measure approximately 0.1 by 1 by 20 µm, although it is likely that they were severed during specimen preparation. Thus these inclusions are considered to represent the type 2 inclusions noted earlier in the optical examination. Ilmenite inclusions survived HF digestion of the quartz grains and were present in the HF residue that was examined by SEM. The digestion residue was shown by EDS analysis to consist only of Fe, Ti, oxygen, and trace Mn and K (the latter element is a common contaminant from HF). The residue mass contains a few type 2 ilmenite ribbons corresponding in size to those observed during the STEM examination. However, the majority of the residue material was revealed by STEM imaging to consist of the type 1 ilmenite crystals. An unknown percentage of the small crystals in the residue may have been derived from the type 2 ilmenite crystals by the digestion process; however, a volumetric dominance of type 1 over type 2 ilmenites was also observed during STEM imaging of undigested blue quartz. Therefore it is concluded that the bulk of the inclusions in the blue quartz consists of the type 1 ilmenite inclusions, although it is difficult to estimate the mass ratio of type 1 to type 2 inclusions with precision. Thirteen electron-microprobe analyses of ten blue quartz phenocrysts have a mean FeO, (wt%) value of 0.013(9) (2v) and a mean TiO2 (wt%) value of 0.030(16) (2c). These data suggest that this blue quartz is significantly enriched in Fe and Ti relative to colorless quartzes, which typically have FeO, and TiO2 concentrations less than 0.01 wt%, and often 0.005 wt% or less (Frondel, 1962; Nash and Crecraft, 1985). This conclusion is more definitive if the analytically superior (± 5%) INAA Fe determinations (described below) of the blue quartz separate (0.022 wt% FeO) are considered. Blue quartz samples from other localities have reported FeO, concentrations of 0.001 to 0.70 wt% and TiO2 concentrations of 0.002 to 0.07 wt% (Frondel, 1962).
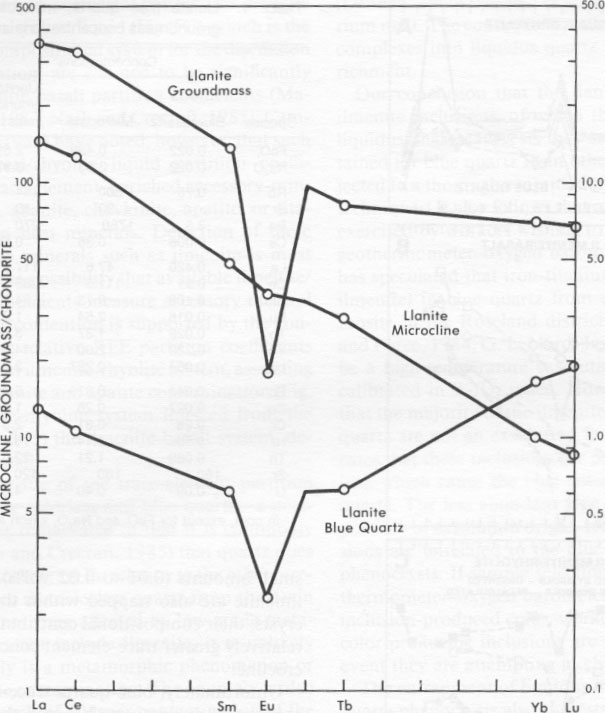
Microprobe analysis of groundmass ilmenite and magnetite yields compositions near end member FeTiO 3 and Fe3O4, respectively. A relatively large pyrophanite (MnTiO3) component, up to 15 mol%, is present in groundmass ilmenite. Strong partitioning of Mn into ilmenite relative to coexisting magnetite is a commonly observed phenomenon, particularly in high-silica rhyolitic rocks (Czamanske and Mihalik, 1972; Czamanske et al., 1981) and in regionally metamorphosed rocks (Rumble, 1976). Using the techniques of Spencer and Lindsley (1981) with the modifications of Andersen and Lindsley (1985), analyses from coexisting groundmass oxide phases result in consistent calculated temperatures and oxygen fugacities of 396 ± 125 °C and 10-3215 bars for the recalculation technique of Anderson (1968), Lindsley and Spencer (1982), and Stormer (1982). The high Mn content of llanite groundmass ilmenites, as well as their low apparent temperatures and oxygen fugacity values, preclude great confidence in these calculations (as they involve computational extrapolations, Rumble, 1976; Czamanske et al., 1977); however, these low values clearly do not represent the original magmatic conditions. Therefore these data support earlier suggestions (DeLong and Long, 1976) that the llanite rhyolite was affected by a very low grade metamorphic event (subgreenschist) subsequent to its crystallization. However, extensive element redistribution at the whole-rock or mineral scale is not expected to be significant at this low metamorphic grade.INAA analyses The concentrations of FeO t, Na2O, and trace elements in the blue quartz and microcline phenocrysts and groundmass of the llanite rhyolite are listed in Table 1. The chondrite-normalized rare-earth-element (REE) concentrations of these phases are plotted in Figure 4. The llanite groundmass is enriched in Hf, Th, Zr, U, and REE, particularly LREE (La and Ce have concentrations greater than 300 times the chondritic value). A large negative Eu anomaly (Eu/Eu* = 0.15) characterizes the groundmass (Eu* is the Eu value derived by interpolating between the neighboring REE Sm and Gd). The microcline phenocrysts have 0.429 wt% FeO, and 3.63 wt% Na2O and are enriched in Rb and Ba. The chondrite-normalized REE pattern of the microcline decreases from La to Lu, with little or no Eu anomaly.The blue quartz phenocrysts are depleted in all elements relative to llanite groundmass, but have relatively high concentrations of Hf, Zr, and HREE. A negative Eu anomaly (Eu/Eu* = 0.38) is present. Although several notable compositional differences between blue and colorless quartz are discussed later, there are also some compositional similarities. The Ba concentration of 3.5 ppm for the blue quartz is similar to that reported for colorless quartz (0.45 to 13 ppm Ba, Ghiorso et al., 1979; Fourcade and Allegre, 198 1). The blue quartz has equal concentrations of FeO, and Na2O (0.022 wt%). This Na concentration falls within the range (2 to 683 ppm Na) reported for colorless quartz (Frondel, 1962; Ghiorso et al., 1979; Nash and Crecraft, 1985). The Fe enrichment of the blue quartz relative to colorless quartz was noted earlier. From the Fe concentration determined by INAA, it may be calculated that the blue quartz contains either 0.014 or 0.024 vol% (assumed stoichiometric, pure endmember) ilmenite, depending on whether the quartz lattice itself contains either a relatively high (0.008%) or low (0.001%) (Frondel, 1962; Nash and Crecraft, 1985) concentration of Fe, respectively.
DISCUSSION AND CONCLUSIONS Transmission electron microscopy of the llanite blue quartz revealed the presence of ubiquitous, rounded type 1 inclusions of ilmenite, averaging =0.06 μm in diameter. These inclusions produce the blue color of this quartz by the phenomenon of Rayleigh scattering. These type 1 inclusions probably make up most of the foreign inclusions within the quartz. The intensity of blue coloration in the quartz varies directly with the number density of these type 1 ilmenite inclusions. Apatite and zircon inclusions, reported from llanite blue quartz by Iddings (1904) and Barker and Burmester (1970), respectively, and believed by them to be the cause of both the blue color and chatoyance, were not encountered in the present study. The type 2 ilmenite ribbons present in the llanite blue quartz measure ~0.1 by 1 by 20 µm, and are therefore in general too large to cause blue coloration by Rayleigh scattering. In certain orientations, constructive reflection from these inclusions is observed to produce an intense white flash as a result of their alignment along (probably rhombohedral) growth planes of the enclosing quartz phenocrysts. In a section cut normal to the c axis of a quartz phenocryst, six such chatoyant reflections, separated by angles of 60°, are observed.
The trace-element data collected for the blue quartz allows discrimination between an exsolution or magmatic crystallization origin for the ilmenite inclusions. The partitioning of a trace element between the llanite melt and the crystallizing quartz phenocrysts is adequately described by a simple Nernst partition coefficient (McIntire, 1963). On the other hand, if the ilmenite formed by exsolution during either subsolidus cooling, metamorphic heating, or deformation, the trace-element partition coefficients of the blue quartz would be governed solely by the initial colorless quartz-melt equilibria. Trace-element partitioning between the blue quartz and the exsolving ilmenite would not affect the original bulk composition of the blue quartz. The shape of the trace-element partition-coefficient pattern for blue quartz formed by an exsolution process would be similar to that of colorless quartz. The shapes of these patterns are determined by the relative differences between trace-element partition coefficients in a given mineral. These relative differences (i.e., the shapes of the patterns) do not vary significantly as a function of temperature, pressure, oxygen fugacity, and bulk liquid composition, in contrast to the absolute values of the partition coefficients (Philpotts, 1978). Alternatively, if the ilmenite inclusions are early-crystallizing phases that have been trapped in the blue quartz crystals growing in the llanite, the trace-element partition coefficients of the blue quartz would reflect both colorless quartz-melt equilibria and ilmenite-melt equilibria. In this case, the shape of the trace-element partition-coefficient pattern for blue quartz would reflect a combination of the patterns for colorless quartz and ilmenite. Mineral/melt partition coefficients for the llanite blue quartz and microcline phenocrysts were calculated by dividing their trace-element concentrations by those of the groundmass (Table 1). This exercise assumes that the quartz and microcline phenocrysts crystallized in equilibrium with a melt of the same composition as the groundmass. The microcline partition coefficients are characterized by high values for Rb, Sr, and Ba, a preference for LREE over HREE, and a positive Eu anomaly. Alkali feldspar/liquid partition coefficients reported elsewhere (Mahood and Hildreth, 1983; Nash and Crecraft, 1985) are similar, but have lower absolute values for several trace elements including the REE.
Mineral/melt partition coefficients determined for the llanite blue quartz show that this quartz is enriched in Cr, Co, Sc, HREE, Hf, Zr, and U relative to the LREE (Fig. 5A). In contrast, it is widely assumed (cf. Cullers et al., 1981) that colorless quartz does not preferentially partition any one trace element relative to another. However, the requisite compositional data needed to confirm this assumption have been collected only for colorless quartz from rhyolitic lavas of the Twin Peaks volcanic complex, Utah (Nash and Crecraft, 1985). The Twin Peaks colorless quartz displays relatively flat REE patterns and little or no Sc, Hf, and U enrichment relative to the LREE (Fig. 5A). Both the llanite blue quartz and the Twin Peaks colorless quartz exhibit large positive Eu anomalies. The contrasting partition coefficient patterns of the two quartz types suggest that the trace-element composition of the llanite blue quartz is not governed solely by colorless quartz-melt equilibria. Consequently, it is doubtful that a majority of the ilmenite included within the blue quartz formed by exsolution. In contrast, the partition-coefficient data are consistent with the hypothesis that the blue quartz includes a contribution from ilmenite inclusions crystallized from a melt with the composition of the llanite groundmass. Mineral/ melt partition coefficients determined for ilmenite in equilibrium with basaltic liquid (Fig. 5B) generally increase with atomic number for the REE, except for a negative Eu anomaly, and are enriched in Hf and Zr relative to Lu, and in Sc and Co relative to La. It is easily determined from a comparison of Figures 5A and 5B that mixtures of ilmenite and colorless quartz yield apparent partition coefficients with relative values similar to those of the llanite blue quartz. These data suggest (1) the majority of the ilmenite inclusions (probably the more pervasive type 1 inclusions) are early-fractionating phases that have been trapped within the quartz and (2) no other early-crystallizing phases are present within the quartz. If small amounts (0.01 to 0.02 vol%) of early-crystallized ilmenite are also trapped within the microcline phenocrysts, their compositional contribution is masked by the relatively greater trace-element concentrations of the microcline.
TABLE 1. Llanite blue quartz, microcline microperthite, and groundmass
concentrations and partition coefficients
* In ppm, except for FeO, and Na 2O, which are in wt % .
Unfortunately, blue quartz trace-element data cannot completely discriminate between the two different types of ilmenite inclusions. The chemical data presented here are compatible with a crystallization mode of origin for both types of inclusions. If this scenario is correct, then the two types of ilmenite found within the blue quartz probably nucleated at separate locations or times and were then incorporated together into the growing quartz crystals. It seems improbable that two ilmenite types with such dissimilar morphologies could have nucleated together. In this instance, it is also possible that the type 2 ilmenite crystals nucleated onto clusters of smaller, preexisting type 1 ilmenite crystals, although this possibility was not investigated in the present study. It is also possible, however, that some part of either type of ilmenite inclusion, or one type in entirety, formed by exsolution processes. This alternate scenario is permitted because the exsolution process would have no effect on the blue quartz bulk trace-element composition. However, since it is probable from the present trace-element study that most of the ilmenite in the llanite blue quartz crystallized from the rhyolite magma before or during the formation of the quartz phenocrysts, if one type of ilmenite inclusion formed in entirety by exsolution, it was most likely the volumetrically inferior type 2 inclusions. If the type 2 ilmenite crystals indeed formed by exsolution, it remains possible that they nucleated onto pre-existing type 1 ilmenite crystals. The shapes of partition-coefficient patterns for ilmenite in equilibrium with rhyolitic liquid (Fig. 5C), which is the more appropriate compositional system for the discussion of llanite crystallization, are claimed to be significantly different from ilmenite/basalt partition coefficients (Mahood and Hildreth, 1983; Nash and Crecraft, 1985). Cameron and Cameron (1986) have noted, however, that such "anomalous" mineral/rhyolite liquid partition coefficients may reflect trace-element-enriched accessory-mineral inclusions (e.g., allanite, chevkinite, apatite, or titanite) trapped within host minerals. Detection of these inclusions in opaque minerals such as ilmenite is most difficult and allows the possibility that available ilmenite/ rhyolite partition coefficients measure accessory mineral contamination. This contention is supported by the consistency between the relative REE partition coefficients for (1) the recalculated ilmenite-rhyolite system, assuming small amounts of allanite and apatite contamination (Fig. 5C), (2) the ilmenite-rhyolite system inferred from the blue quartz data, and (3) the ilmenite-basalt system, determined experimentally. The one characteristic of the trace-element partition coefficients shared by colorless and blue quartz - a positive Eu anomaly - is remarkable in that it is commonly assumed (e.g., Nash and Crecraft, 1985) that quartz does not preferentially incorporate Eu relative to the other rare-earth elements. Since the colorless quartz from the Twin Peaks rhyolite has not been affected by low-grade metamorphism and does not include ilmenite, it is unlikely that the Eu anomaly is a metamorphic phenomenon or the result of ilmenite contamination. The anomaly is also unlikely to be the result of feldspar contamination of the blue quartz separate, because inclusions in or adhesions on a transparent mineral such as quartz are easily identified during microscopic examination. In order to produce this Eu anomaly by feldspar contamination, it would be necessary for 33% of the blue quartz separate (partition coefficient Eu/Eu* = 2.60) to consist of the analyzed llanite microcline microperthite (partition coefficient Eu/Eu* = 5.83). Besides being a very evident proportion of the handpicked sample, this amount of contamination would require the quartz separate to exhibit FeO, (0.14 wt%), Na2O (1.2 wt%), and trace-element concentrations that are much higher than those observed. There are at least two crystal-chemical explanations for the Eu anomaly, both involving the reduction of Eu 3+ to Eu2+. The first explanation is that Eu2+ may enter into sixfold coordination with oxygen and thus form a substitutional solid solution in quartz, analogous to the supposed behavior of Mg2+ (Frondel, 1962). Differences in the ionic radii of Si4+ (0.40 Å) and Eu2+ (1.31 Å) (Shannon and Prewitt, 1969) preclude direct substitution.A second explanation involves the formation of complexes of Eu 2+ with aluminosilicate (Al2Si2O82-) in magmatic liquids (Moller and Muecke, 1984). These complexes may be more similar to the structure of crystalline quartz, which is typically characterized by substitution of Si by Al and a valence compensation ion such as Na (Dennen, 1966; Ghiorso et al., 1979), than to the equilibrium melt. The consequent preferential partitioning of the complexes into liquidus quartz would result in Eu2+ enrichment.Our conclusion that the llanite blue quartz contains ilmenite inclusions, of which the majority (at least) are liquidus phases, suggests that the same result may be obtained for blue quartz from other locales, if they are subjected to a thorough examination using modern analytical techniques. It also follows that extreme caution should be exercised by workers wishing to develop blue quartz as a geothermometer-oxygen barometer. For example, Nord has speculated that iron-titanium oxide grains (probably ilmenite) in blue quartz from a leucocharnockite-anorthosite in the Roseland district, Virginia (cited in Herz and Force, 1984; G. L. Nord, Jr., pers. comm., 1986) may be a high-temperature exsolution feature that could be calibrated in T-fÔ 2 space. However, INAA data indicate that the majority of the ilmenite inclusions in llanite blue quartz are not an exsolution feature. STEM imaging indicates that these inclusions are probably the type 1 ilmenites, which cause the blue coloration in the llanite blue quartz. The less abundant type 2 ilmenite inclusions are possibly of exsolution origin. However, these latter inclusions are unrelated to the blue coloration of the quartz phenocrysts. If sample selection for the blue quartz geothermometer-oxygen barometer is made on the basis of inclusion-produced color, workers should ensure that the color-producing inclusions are genetically related to the event they are attempting to characterize.The entrapment of liquidus ilmenite in the llanite blue quartz phenocrysts also suggests that the llanite melt was capable of crystallizing ilmenite very early in its crystallization history. Early ilmenite saturation may occur primarily in melts extraordinarily rich in Ti and Fe. It has also been established, however, that ilmenite saturation is promoted by decreasing temperature, increasing pressure, increasing oxygen fugacity, and increasing concentrations of silica, alkalis, and REE in equilibrium liquids (Green and Pearson, 1986a). The inset in Figure 6 shows a significant lowering of the TiO2 content required for ilmenite saturation by these additional conditions. The llanite rhyolite certainly exhibits a high-silica, alkali-rich (75 wt% SiO2, 8.0 wt% Na2O + K2O; Goldich, 1941; Barker and Burmester, 1970), REE-enriched composition, but in the absence of quantitative compositional data for the ilmenite inclusions, estimates of their temperature, pressure, and oxygen fugacity of crystallization are precluded. DeLong and Long (1976) suggested that Fe- and Ti-rich melarhyolite dikes of the Llano uplift may be related genetically to the llanite rhyolite. The melarhyolite contains lower concentrations of silica and higher concentrations of Fe and Ti relative to the llanite rhyolite (Fig. 6). Some of the melarhyolite contains minor groundmass blue quartz. In comparison to the massive granites of the Llano uplift, the melarhyolite exhibits greater Fe and somewhat greater Ti concentrations, whereas the llanite rhyolite is clearly enriched in both Fe and Ti at the 75 wt% SiO2 level (Fig. 6). Blue quartz has not been identified in the massive Llano granites.
It is possible that some combination of low-temperature, high-pressure, or high-oxygen fugacity conditions allowed early ilmenite saturation in the Ti-, Fe-, REE-, alkali-rich, high-silica llanite rhyolite melt. A hypothetical Ti-rich phase solubility curve drawn in TiO2-SiO2 space to allow early ilmenite crystallization in the llanite rhyolite and in some of the melarhyolites is compatible with experimentally determined curves for similar compositions at <=900 °C, 7.5 kbar, and the fÔ2 of the hematite-magnetite (HM) buffer (Fig. 6). If this model is correct, the restriction of blue quartz largely to middle to late Proterozoic and some older rocks may reflect preferential production of the required high Ti-Fe felsic magma compositions and their crystallization under low-temperature, high-pressure, or high fo 2 conditions during this time. It is well known that a distinctive Fe- and Ti-rich suite of A-type (rapakivi) granites, massiftype anorthosites, and mangeritic rocks is largely confined to the middle to late Proterozoic (Emslie, 1978; Anderson, 1983). In some cases, blue quartz may be another manifestation of this type of magmatism.ACKNOWLEDGMENTS We thank G. Rossman,. G. L. Nord, Jr., J. B. Thompson, and D. Gust for helpful comments and calculations. We appreciate the helpful reviews of this manuscript by G. McKay, D. Gust, and G. L. Nord., Jr. D. S. McKay, G. McKay, and D. Blanchard kindly provided access to the electron-beam and INAA facilities of the Solar System Exploration Division at the NASA/Johnson Space Center. B. Bansal graciously performed the HF digestion. T. Cobliegh is acknowledged for enlightening us as to the significance of this problem and ensuring that we remained sensitive to the particular needs of the llanite. REFERENCES CITED Andersen, D.J., and Lindsley, D.H. (1985) New (and final!) models for the Ti-magnetite/ilmenite geothermometer and oxygen barometer. EOS 66, 416. Anderson, A.T. (1968) Oxidation of the LaBlanche Lake titaniferous magnetite deposit, Quebec. Journal of Geology, 76, 528-547. Anderson, J.L. (1983) Proterozoic anorogenic granite plutonism of North America. Geological Society of America Memoir 161, 133-154. Barker, D.S., and Burmester, R.F. (1970) Leaching of quartz from Precambrian hypabyssal rhyolite porphyry, Llano County, Texas. Contributions to Mineralogy and Petrology, 28, 1-8. Barnes. V.E., Dawson, R.F., and Parkinson, G.A. (1947) Building stones of central Texas. Texas University Publication 4246, 198 p. Cameron, K.L., and Cameron, M. (1986) Whole-rock/groundmass differentiation trends of rare earth elements in high-silica rhyolites. Geochimica et Cosmochimica Acta, 50, 759-770. Clabaugh, S.E., and McGehee, R. V. (1963) Precambrian rocks of the Llano region, Texas University Bureau of Economic Geology Guidebook 5, 63-78. Clarke, J.W. (1984) The core of the Blue Ridge anticlinorium in northern Virginia. Geological Society of America Special Paper 194, 155-160. Cullers, R.L., Koch, R.J., and Bickford, M.E. (1981) Chemical evolution of magmas in the Proterozoic terrane of the St. Francis Mountains, southern Missouri; 2. Trace element data. Journal of Geophysical Research. 86, 10388-10401. Czamanske, G.K., and Mihalik, P. (1972) Oxidation during magmatic differentiation, Finnmarka complex, Oslo area. Norway; 1. The opaque oxides. Journal of Petrology, 13, 493-509. Czamanske. G.K., Wones, D.R., and Eichelberger, J.C. (1977) Mineralogy and petrology of the intrusive complex of the Pliny Range, New Hampshire. American Journal of Science, 277, 1073-1123. Czamanske, G.K., Ishihara, S., and Atkin, S.A. (1981) Chemistry of rockforming minerals of the Cretaceous-Paleocene batholith in southwestern Japan and implications for magma genesis. Journal of Geophysical Research, 86. 1043 1-10469. DeLong, S.E.. and Long, L.E. (1976) Petrology and Rb-Sr age of Precambrian rhyolitic dikes. Llano County, Texas. Geological Society of America Bulletin, 87. 275-280. Dennen, W.H. (1966) Stoichiometric substitution in natural quartz. Geochimica et Cosmochimica Acta, 30, 1235-1241. Emerson. B.K., and Perry, J.H. (1907) The green schists and associated granites and porphyries of Rhode Island. U.S. Geological Survey Bulletin 311, 45-46. Emslie, R.F. (1978) Anorthosite massifs, rapakivi granites, and Late Proterozoic rifting of North America. Precambrian Research. 7. 61-98. Fourcade, F., and Alftre. C.J. (1981) Trace clement behaviour in granite genesis: A case study. The calc-alkaline plutonic association from the Querigut Complex (Pyrenees. France). Contributions to Mineralogy and Petrology, 76. 177-195. Frondel, C. (1962) The system of mineralogy: Vol. III. Silica minerals, 334 p. Wiley, New York. Ghiorso, M.S.. Carmichael, I.S.E., and Moret, L.K. (1979) Inverted hightemperature quartz. Unit cell parameters and properties of the alphabeta inversion. Contributions to Mineralogy and Petrology, 68, 307323. Goldich, S.S. (1941) Evolution of the central Texas granites. Journal of Geology. 49, 697-720. Goldschmidt, V.M. (1954) Geochemistry, 365 p. Clarendon Press, Oxford. Green, T.H., and Pearson, N.J. (1986a) Ti-rich accessory phase saturation in hydrous mafic-felsic compositions at high P, T. Chemical Geology 54, 185-201. _______ (1986b) Rare-earth element partitioning between sphenc and coexisting silicate liquid at high pressure and temperature. Chemical Geology, 55, 105-119. Haskin, L.A., and Korotev, R.L. (1977) Test of a model for trace element partition during closed-system solidification of a silicate liquid. Geochimica et Cosmochimica Acta, 41, 921-939. Haskin, L.A., Haskin, M.A., Frey. F.A., and Wildeman, T.R. (1968) Relative and absolute terrestrial abundances of the rare earths. In L.H. Ahrens, Ed.. Origin and distribution of the elements, p. 889-912. Pergamon, New York. Herz. N., and Force, E. (1984) Rock suites in Grenvillian terrane of the Roseland district, Virginia. Part 1. Lithologic relations. Geological Society of America Special Paper 194, 187-200. Iddings. J.P. (1904) Quartz-feldspar-porphyry (graniphyro liparose-alaskose) from Llano, Texas. Journal of Geology, 12, 225-231. Jacobs, J.W., Korotev, R.L., Blanchard. D.P., and Haskin, L.A. (1977) A well-tested procedure for instrumental neutron activation analysis of silicate rocks and minerals. Journal of Radioanalytical Chemistry, 40. 93-114. Jayaraman, N. (1939) The cause of colour of the blue quartzes of the charnockites of South India and the Champion Gneiss and other related rocks of Mysore. Proceedings of the Indian Academy of Sciences. 9. 265-285. Lindsley, D.H., and Spencer, K.J. (1982) Fe-Ti oxide geothermometry: Reducing analyses of coexisting Ti-magnetite (Mt) and ilmenite (Ilm) (abs). EOS, 63, 471. Mahood, G., and Hildreth, W. (1983) Large partition coefficients for trace elements in high-silica rhyolites. Geochimica et Cosmochimica Acta, 47, 11-30. McConnell, K.1.. and Costello, J.O. (1984) Basement-cover rock relationships along the western edge of the Blue Ridge thrust sheet in Georgia. Geological Society of America Special Paper 194, 263-280. McIntire, W.L. (1963) Trace element partition coefficients-A review of theory and applications to geology. Geochimica et Cosmochimica Acta, 27,1209-1264. McKay, G.A., and Weill, D. F. (1976) Petrogenesis of KREEP. In Proceedings of the Seventh Lunar Science Conference. p. 2427-2447. Pergamon Press, New York. McKay, G., Wagstaff, J., and Yang, S.-R. (1986) Zirconium, hafnium, and rare earth element partition coefficients for ilmenite and other minerals in high-Ti lunar mare basalts: An experimental study. In Proceedings of the Sixteenth Lunar and Planetary Science Conference. Part 2. Journal of Geophysical Research, 91, D229-D237. Moller, P., and Muecke. G. K. (1984) Significance of europium anomalies in silicate melts and crystal-melt equilibria: A re-evaluation. Contributions to Mineralogy and Petrology, 87. 242-250. Nagasawa, H. (1970) Rare earth concentrations in zircons and apatites and their host dacites and granites. Earth and Planetary Science Letters. 9. 359-364. Nakamura. Y.. Hirokazu. F.. Nakamura, N., Tatsumoto, M.. McKay, G.A.. and Wagstaff, J. (1986) Hf, Zr, and REE partition coefficients between ilmenite and liquid: Implications for lunar petrogenesis. In Proceedings of the Sixteenth Lunar and Planetary Science Conference, Part 2. Journal of Geophysical Research, 91, D239-D250. Nash, W.P., and Crecraft. H.R. (1985) Partition coefficients for trace elements in silicic magmas. Geochimica et Cosmochimica Acta, 49, 2309-2322. Nassau, K. (1983) The physics and chemistry of color, p. 233-249. Wiley, New York. Niggli, E.. and Thompson, J.B. (1979) Petrogcnetic significance of blue, opalescent quartz in metamorphic rocks. Memorie degli Istituti di Geologic e Mineralogia dell' Iniversitä di Padova, 33, 258. Parker, R.B. (1962) Blue quartz from the Wind River Range. Wyoming. American Mineralogist. 47, 1201-1202. Paster, T.P., Schauwecker, D.S., and Haskin, L.A. (1974) The behavior of some trace elements during solidification of the Skaergaard layered series. Geochimica et Cosmochimica Acta, 38, 1549-1577. Philpotts, J.A. (1978) The law of constant rejection. Geochimica et Cosmochimica Acta, 42. 909-920. Postelmann. A. (1937) Die ursache der blaufarbung gesteinsbildender quarze. Neues Jahrbuch für Mineralogie, Geologie and Palaontologie, 72,401-440. Robertson. R. (1884) Examination of blue quartz from Nelson Co., Va. Chemical News, 50, no. 1301, 207. ________ (1885) An examination of blue quartz from Nelson County, Virginia. The Virginias, 6. 2-3. Rumble. D. (1976) Oxide minerals in metamorphic rocks. Mineralogical Society of America Short Course Notes, 3, R1-R24. Shannon, R.D., and Prewitt, C.T. (1969) Effective ionic radii in oxides and fluorides. Acta Crystallographica, A25, 925-946. Shaw, S.E., and Flood, R.H. (1981) The New England batholith, eastern Australia: Geochemical variations in time and space. Journal of Geophysical Research, 86, 10530-10544. Spencer, K.J., and Lindsley, D.H. (1981) A solution model for coexisting iron-titanium oxides. American Mineralogist, 66, 1189-1201. Stormer, J.C. (1982) The recalculation of multicomponent Fe-Ti oxide analyses for geothermometry: A quasi-thermodynamic model (abs.). EOS, 63, 471. Watson, T.L., and Beard, R.E. (1917) The color of amethyst, rose, and blue varieties of quartz. Proceedings of the U.S. National Museum, 53, 553-563. NOTES * Present address: Department of Geoscience, New Mexico Institute of Mining and Technology, Socorro, New Mexico 87801, U.S.A.
MANUSCRIPT RECEIVED FEBRUARY 16, 1987
|
||||||||||||||||||||||||||||||||||||||||||||||||||||||||||||||||||||||||||||||||||||||||||||||||||||||||||||||||||||||||||||||||||||