| Home | AmMin | GMR | RiMG | Collectors Corner | Directory | Short Courses | |
|
|
|||||||

|
|
Volume 64, pages 160-168, 1979 Coloring mechanisms in celestite LAWRENCE R. BERNSTEIN Department of Geological Sciences, Harvard University Abstract The common pale-blue color of celestite bleaches at about 200°C and reappears upon X-ray irradiation. A thermoluminescence maximum for blue celestite also occurs around 200°C. The thermal stability of the blue color (as measured by the bleaching time at 190°C) was found to be proportional to potassium content. Electron spin resonance data indicate the presence of SO 4-, SO3-, SO2-, and O- in blue celestite crystals. These paramagnetic hole centers presumably arise by the action of ionizing radiation on SO42-, which releases energetic electrons that can decompose other SO42- groups. The centers SO3-, SO2-, and O- absorb in the visible, producing the blue color, while SO4- absorbs in the ultraviolet. The color-producing centers are stabilized in the celestite lattice by the presence of trace components, primarily K+ substituting for Sr2+.The color in two specimens of orange celestite was correlated to the presence of copper, probably as Cu+, in the order of 50 ppm. Introduction The cause of the common pale-blue color of celestite, SrSO4, has long been disputed, and has been the subject of many investigations. In this report some new data are presented on blue and orange celestite, and possible models are derived for the causes of these colors. Previous hypotheses The numerous hypotheses that have been proposed for the coloring mechanism in blue celestite can be summarized as follows: 1. Organic inclusions (Stromeyer, 1821, p. 203-211; Weinhold, 1864). The mechanism whereby these inclusions produce the blue color was not described. 2. Vivianite inclusions (Wittstein, 1856). 3. Colloidal sulfur inclusions produced by radium radiation (Doelter, 1915, p. 65-66). The color is presumably caused by Tyndall scattering. 4. Colloidal gold inclusions (Friend and Allchin, 1939, 1940). The color is produced by Tyndall scattering and related optical effects. 5. Fe2+ - Fe3+ charge transfer (Vendl and Mandy, 1958). 6. Color centers A. F-centers (electrons filling anion vacancies) i. Alkali ions substitute for strontium, producing anion vacancies and interstitial alkali ions, which both act as electron traps (Schulman and Compton, 1962, p. 256-273, 281-282). ii. Caused by ionization of Sr to Sr+ + e-, with the electron filling an SO42- vacancy (Isetti, 1970). B. PO4 substitutes for SO4- (proposed for blue barite by Bershov and Marfunin, 1967). C. Presence of monovalent sulfur-containing radicals plus O- (Samoilovich, 1971; Bakhtin et al., 1973). The color is due to absorptions by orbital transitions within these radicals. Chemical analyses Experimental methods Emission spectroscopy was used on several specimens (LB 1, LB 6, LB 8, and LB 10) to obtain semi quantitative analyses of all the minor and trace elements. This was followed by quantitative atomic absorption analyses of all the specimens for the principal minor and trace elements. Routine methods were used for the analyses. Results and discussion The chemical analyses are presented in Table 1. Except for Ba and Ca, which substitute for Sr, the samples are remarkably low in minor and trace elements. An interesting result was the detection of copper in the two orange specimens (LB 5 and LB 10). As this is the only element not also found in the blue specimens in measurable amounts, it may be responsible for the orange color. The absence of detectable gold (< 10 ppm) tends to argue against the colloidal gold theory for the blue color, but does not entirely rule it out. The blue portion of specimen LB 11 contains notably more Na and K than the colorless portion. This is possible evidence that the presence of Na and K in natural crystals may cause the same sensitization to radiation-induced coloration that Schulman et al. (1952) observed in artificially alkali-doped crystals. It is also interesting that LB 6, the darkest blue specimen, has the lowest Na content but a high K content.
Thermal studies Experimental methods The thermal stability of the color in seven specimens of blue celestite and two specimens of orange celestite was investigated. Homogeneously colored crystal fragments without visible impurities, about 20 x 10 x 1.5 mm and weighing about 0.5 g each, were selected. These were broken roughly in half, one half being kept at room temperature as a reference for the original color. The experimental specimens were heated in a small furnace having a Pyrex window and a chromel-alumel thermocouple sensor. Each specimen was observed continuously during the heating, and observations were recorded at every 10°C rise in temperature. The specimens were heated to 850°C, the maximum for this furnace, at which point the specimens were incandescent. A heating rate of 5°C/ min could be maintained without decrepitation of the samples. In addition, the specimens were heated as a group at 190°C for six days in another furnace. The time required for the crystals to become completely colorless was recorded. To study specimens colored by ionizing radiation, specimens were first bleached at 300°C for 30 minutes and irradiated with X-rays as described in the following section. The irradiated specimens were then heated and observed.
Numbers in parentheses are estimated standard deviations. The high Fe, Si, Mg, and Al content of LB 8 is at least partly due to admixed impurities. Looked for but not detected by emission spectroscopy: Ag, As, Au, B, Be, Cb, Cd, Co, Cr, Dy, Er, Eu, Ga, Gd, Ge, Hf, Hg, La, Li, Lu, Mo, Nd, Ni, P, Pb, Pt, Ra, Sb, Sc, Sn, Sm, Ti, U, V, Zn, Zr. Specimens: LB 1 (NMNH* 87183): Amherstburg, Ontario, Canada. Thick tabular crystals. Pale blue. LB 3 (NMNH 87469): Mt. Bonnell, near Austin, Texas. Cleavage fragments. Pale blue. LB 4 (NMNH 119651): Ottawa County, Ohio. Thick tabular crystals. Pale blue. LB 5 (NMNH 104583): Brown County, Kansas. Intergrown tabular crystals. Brownish orange. LB 6 (NMNH 94275): Girgenti, Sicily. Subhedral crystals in parallel growth. Blue. LB 7 (NMNH R16219): El Rayo Mine, Durango, Mexico. Cleavage fragments. Pale blue. LB 8 (NMNH 16758): Jena, Thuringia, Germany. Cross fiber vein 1.5 cm thick. Blue. LB10 (NMNH 116662): Caledon Township, Ontario, Canada. Tabular crystals. Orange. LB11 (HMM 101020): Clay Center, Ohio. Elongated 100, thin tabular {001) crystals. Blue and colorless zones are from the same crystal. *NMNH = National Museum of Natural History, Washington, D.C. HMM = Harvard Mineralogical Museum, Cambridge, Massachusetts.
Table 2. Thermal bleaching data for blue celestite
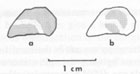
Specimens of vivianite (a transparent green fragment from Cameroun and a blue fibrous specimen from Nelson Island, Alaska) were also heated. Results The blue celestite crystals all began to slowly bleach at around 170°C. The color in all specimens simply became paler, without any detectable change in hue. With increasing temperature, a point was reached at which bleaching became rapid, around 200°C. This temperature, the minimum at which bleaching is rapid, is generally defined as the bleaching temperature. The irradiated crystals showed similar behavior to the natural crystals. The bleaching times at 190°C varied widely, from one minute to about six days (Table 2). The two orange specimens (LB 5 and LB 10) behaved entirely differently, the orange color remaining stable through 850°C. A slight brown tinge to the color was present above 350°C, but this faded upon cooling to room temperature. The fibrous blue vivianite became dark brown at 180°C, and the green vivianite became opaque green at 180°C and dark opaque brown at 250°C. Discussion The very low bleaching temperatures of the blue celestite, not accompanied by changes in color, strongly suggest the presence of color centers. The variable bleaching times and temperatures could indicate the presence of several color centers that have different "trap depths" (the thermal energy needed to destroy the color center). However, since the figures for bleaching times (which are probably the most accurate measure of the thermal stability) do not show a modal distribution, this mechanism does not appear to be likely. It is more likely that the rate of color center destruction is being affected by a variable quantity, such as trace element content. The thermal behavior of the orange celestite virtually precludes the possibility that the orange color is caused by color centers. The thermal behavior of the vivianite is not consistent with the theory that vivianite inclusions cause the blue color of celestite. Irradiation studies Experimental methods Fragments used for irradiation were about 5 x 5 x 1.5 mm. The blue specimens were first bleached at 300°C for 30 minutes, and all became colorless. Several specimens were chosen for particular properties, specifically: (1) colorless and blue sections from a single crystal of LB 11 were both irradiated, and (2) a cleavage fragment of LB 6 that contained a well-defined colorless zone 1 mm thick was irradiated after bleaching. Specimens of LB 1, LB 3, LB 4, LB 7, LB 8, and LB 10 (orange) were also irradiated. The specimens were each taped in front of an unfiltered port on a Philips X-ray generator, with an Fe tube operated at 45 kV and 10 mA. The specimens were observed (with the X-ray generator off) after exposure for 15 min, 30 min, 45 min, 60 min, 90 min, 3 hrs, and at longer intervals if warranted. Several of the specimens were also used in the optical absorption spectrometer, both before and after irradiation, as described in the following section. Results All the originally blue crystals became noticeably blue after 15 minutes of irradiation, and reached the maximum depth of color within 45 minutes. The final depth of color was roughly proportional to the depth of the original color. This latter quantity was somewhat difficult to judge, however, since the color developed most intensely in a paper-thin layer facing the X-ray tube, and faded very rapidly going into the crystals. The orange crystal, LB 10, showed no change after 6 hours. The originally colorless section of LB 11 became only extremely pale blue after 24 hours exposure to the radiation, though the originally blue section quickly became blue. The zoned crystal fragment, LB 6, which was uniformly colorless after bleaching, faithfully reproduced its zoning after irradiation (Fig. 1 ).
Discussion The fact that the blue crystals rather quickly reached a maximum depth of color under radiation indicates an apparent approach to saturation of color-producing sites. The limited number of sites is substantiated by the production of color roughly in proportion to the depth of color originally present, and the failure of originally colorless zones to become significantly colored. The factor controlling the number of color-producing sites could be trace elements, which could either sensitize the blue zones to radiation or quench the color-producing process in the uncolored zones.
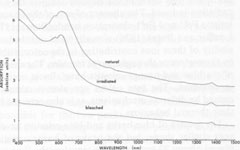
Optical absorption spectroscopy Experimental methods The absorption spectra of blue and orange celestite were investigated in the visible and near-infrared regions. The effects of thermal bleaching and of irradiation on the spectra were also studied. A spectrum of blue barite, from Cumberland, England, was observed for comparison. A Cary-17 spectrophotometer in the transmission mode was used. The illumination was non-polarized, in the range 400 to 1500 rim. Specimens LB 1, LB 6, LB 10, and LB 11 were studied. The specimens consisted of plates about 3 mm thick cut roughly parallel to {001} and polished on both sides, with the exception of LB 11, which was an unpolished tabular {001} crystal about 3 mm thick. Results The absorption spectra of representative specimens are reproduced in Figures 2 and 3. The major absorption peaks in all the blue celestite are at 620±5 nm, 575±5 nm, and <400 nm. The blue color results from absorption at both the red and violet ends of the visible spectrum, with blue light preferentially transmitted. Minor absorption peaks may occur at 540 and 710 nm. There is virtually no difference between the absorption spectra of the natural and irradiated blue celestite specimens.
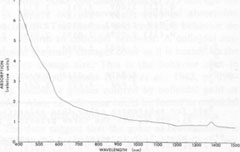
Absorption in the blue barite occurs primarily around 640, 595, and <400 nm. The orange celestite has a multiple peak or absorption edge beginning at 600 nm and extending beyond 400 nm. There is also a small "shoulder" at about 540 nm. No absorption was recorded in the near infrared for any of the specimens. The small peak at about 1385 nm is an instrumental artifact. Discussion Since the absorption spectra of natural and irradiated blue celestite are virtually identical, the sane mechanism is probably responsible for the color in both, and the color in the natural samples may be radiation-induced. The absence of any of the characteristic Fe2+ and Fe3+ absorption bands (Burns, 1970; Loeffler and Burns, 1976) virtually rules out the possibility of these ions contributing to the color, either by themselves or through charge transfer. The spectra of the blue and orange celestite have almost nothing in common. The two colors are almost certainly caused by different mechanisms, as is also revealed by their thermal behaviors.
The spectra of blue barite and blue celestite have a very similar shape, but the peaks of barite are displaced about 20 nm to longer wavelengths (less energy). This shift may be related to the larger unit-cell size of barite (isostructural with celestite), which results in a slightly lower crystal field energy acting on the coloring mechanism. Electron spin resonance spectroscopy Introduction
ESR spectroscopy measures the transitions of unpaired electrons between the spin states ms = ±
½. The technique can detect paramagnetic ions and radicals, and also free unpaired electrons. The transition is generally expressed by the g-factor, where hp =
gµBH (h = Planck's constant, v = frequency of applied alternating magnetic field, µB = Bohr magneton, H = static magnetic field strength). The g-factor in anisotropic crystals is directional and is expressed as the g-tensors
gx, gy, and gz (or, sometimes g||, and
g Table 3. ESR data for celestite and for some related substances
Data for substances other than celestite are in italics. *gi, g2, and g3 are the three principal g-tensors in increasing order; gav is the average value of g. **b. = blue; i. = irradiated; n. = natural. References: 1. Bakhtin et al., 1973; Khasanov et al., 1973; 2. Gromov et al., 1974; 3. Samoilovich et al., 1968; Samoilovich, 1971; 4. Bershov and Marfunin, 1967; 5. Atkins and Symons, 1967; 6. Morton, 1965; 7. Morton, 1969; 8. Samoilovich et al., 1973; 9. Gromov and Morton, 1966; 10. Hogarth et al., 1976.
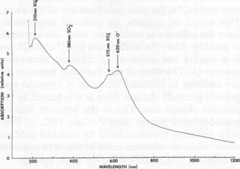
ESR data for celestite All the ESR studies of celestite to date have been done in the USSR. The results of these studies are summarized in Table 3, which also contains ESR data on some related substances for comparison. In addition to the hole centers listed in the table, Gromov et al. (1974) found a weak electron-excess center in celestite, with a g-factor ranging from 1.9965 to 2.0018. The signal was too weak for further analysis. They also calculated the total number of paramagnetic centers to be 1014-1016 per gram of celestite. The paramagnetic hole centers have been identified as monovalent sulfur-containing radicals, with the exception of O-. On the basis of symmetry analysis and other data, Bakhtin et al. (1973) and Khasanov et al. (1973) found that the center previously identified as SO2+ is actually O- in two different sites, O-(I) and O-(II). Since it is assumed that SO3- and SO2- are produced during the irradiation of SO42-, the identification of O- helps account for the oxygen ions produced during these reactions. The g-factors for SO4-, are somewhat variable, which may indicate that this ion-radical occurs in several different orientations, perhaps associated with trace components. The molecule S3-, which causes the blue color in lazurite (Hogarth and Griffin, 1976), was not detected in celestite, nor were S2-, S-, or S2O2-. The major paramagnetic centers in the studied celestite are therefore SO3-, O-, and SO4-, with smaller amounts of SO2-, and possibly a weak electron-excess center. The implications of these centers will be considered in the general discussion. Thermoluminescence Weak thermoluminescence of celestite was reported by Doelter (1915, p. 65-66) and Przibram (1956, p. 241-242), but the only quantitative study was made by Gromov et al. (1974). They reported the presence of two thermoluminescence peaks, one at 80-100°C and the other at 180-240°C. As noted earlier, bleaching of the blue color occurs at 190-220°C, corresponding to the high-temperature peak. This peak thus probably represents the annealing of the centers responsible for the blue color. The low-temperature peak probably represents annealing of centers that absorb outside of the visible (probably in the ultraviolet), since no bleaching was observed at this low temperature. Gromov et al. (1974) reported that SO4- anneals in the range of the low-temperature peak, while SO3-, anneals in the range of the high-temperature peak, which strongly suggests that these radicals are responsible for the two peaks. Gromov et al. also include the annealing of SO2- and possibly SO2+ (actually O-) in the high-temperature peak. They calculate the trap depth (ET) as 0.4 eV for the low temperature peak, and 0.6 eV for the high-temperature peak. They attribute the variations in the positions of the peaks to differing concentrations of trace elements, which may stabilize the centers. Ultraviolet spectroscopy The only published ultraviolet spectrum of celestite is that by Isetti (1970). This absorption data is included in Figure 4. The ultraviolet absorption bands will be considered in the general discussion. Discussion The available data either do not support, or tend to contradict, the following hypotheses on the coloring mechanism in blue celestite: (1) organic inclusions; (2) vivianite inclusions; (3) Fe2+-Fe3+ charge transfer; (4) electron-excess centers; and (5) PO43- substitution. The data also point strongly away from the possibility of colloidal gold or sulfur inclusions, with these factors being the most important: (1) No gold was detected in the analyses. (2) The optical absorption spectra for the blue specimens are all the same. This would be unlikely for colloidal suspensions, since the colloid size would vary from one specimen to another. Also, the double peak at 575 and 620 nm is a feature not observed in colloidal absorption spectra. (3) The thermal and radiation behavior do not conform to colloidal behavior. A colloidal suspension generally changes color as it is heated, as the particles change size. This is the behavior seen in colloid-colored glasses (Lewis et al., 1942, p. 299-301), including glasses colored by colloidal gold or sulfur. Also, no reference could be found to colloidal suspensions that become colorless upon heating. The data suggest that the color of blue celestite is related to the presence of radiation-induced hole centers, specifically monovalent sulfur-containing radicals and O-. This possibility is supported by ESR studies, which have repeatedly detected considerable amounts of SO3-, O-, SO4-, and SO2- in natural and irradiated blue celestite. The questions still remain, however, of (1) how these hole centers are related to the optical absorptions, and (2) why the color should form in some specimens and not in others. These questions are best considered by proceeding in two directions: (1) Correlation of hole centers with optical absorption bands. Since monovalent sulfur-containing radicals and O- are present, the possible transitions producing absorption in the visible are best modeled by using molecular and atomic orbital theories. (2) Correlation of color with chemical composition. Since pure SrSO4 does not become colored by radiation (Schulman et al., 1952), it is reasonable to assume that minor and trace elements are in some way related to the coloring mechanism, and therefore are probably related to the stability of the monovalent sulfur-containing radicals and O-. Optical and ultraviolet absorption From molecular orbital theory, the radical SO4- is expected to have the electronic configuration (1a1)2(1t2)6(2t2)6(1e)4(1t1)6(3t2)8(2a1)1 in the ground state 2A1 (Samoilovich, 1971). A likely transition is (1e)4(1t1)6(3t2)6(2a1)1 → (1e)3(3t1)6(3t2)6(2a1)2 which absorbs at 200-250 nm (Samoilovich, 1971). This is probably the cause of the absorption at 210 nm found by Isetti (1970). In a similar way, the most likely transition for SO2- is calculated to be at 300-400 nm (Samoilovich, 1971). Bakhtin et al. (1973) calculated that the most likely transition for SO3- is around 600 nm in blue barite. I found that this absorption peak is shifted to 575 nm in celestite, so that SO3- may be responsible for the peak.
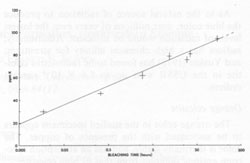
Finally, transitions in the O-(I) and O-(II) centers give absorptions at 620 and 650 nm, causing the broad absorption peak in this range (Bakhtin et al., 1973). All of these identifications are summarized in Figure 4. Role of minor and trace elements For information on the role of minor and trace elements, we must turn to the chemical analyses, and consider the crystal chemistry of celestite. Schulman et al. (1952) found that pure synthetic SrSO4 is insensitive to radiation-induced coloration, while the presence of Na+ or K+ in the order of one mole percent greatly enhances the sensitivity. They also found that coexistent La3+ or Cl- quenches the sensitivity, though concomitant substitution of Ba2+ or Ca2+ has virtually no effect on the sensitivity. My analyses (Table 1) show that in at least one natural case (specimen LB 11) the blue zone of a crystal contains considerably more Na and K than the colorless portion, especially regarding the K content. Also, the colorless part of the crystal is nearly insensitive to irradiation by X-rays. To explore the relationship of chemical composition to color, the amount of each constituent was compared to the most quantitative measure of the stability of coloration, the bleaching time at 190°C (Table 2). No consistent relationship was found for Na, Fe, Mg, Ba, or Ca, but a striking correlation was found between bleaching time and the potassium content (Fig. 5). The possible reasons for the relation between potassium content and the stability of the color become apparent if we consider the crystal chemistry of celestite. Complete isomorphous substitution of Sr and Ba occurs in the series celestite-barite. Celestite can contain only limited amounts of Ca, however. The K+ ion is virtually the same size as Ba2+, while Na+ is nearly the same size as Ca2+, implying that K+ should be able to substitute for Sr2+ much more readily than Na+ This is analogous to the situation found in feldspars. In feldspars, Ca2+ and Na+ mutually substitute in plagioclase, and K+ and Ba2+ mutually substitute in the series orthoclase-celsian, though there is little substitution between the two series at low temperatures. Model of the coloring mechanism in blue celestite A possible model for the formation of color-producing monovalent sulfur-containing radicals and O- coupled with the presence of K+ can now be constructed. The details of this model, however, remain highly tentative. It is first assumed that Sr2+ is much more likely to be replaced by K+ than by Na+(though some replacement by Na+ does occur). The charge imbalance from this substitution may be compensated by the presence of interstitial ions, perhaps Na+ or H+. Under the influence of ionizing radiation, electrons are released from SO42- groups (equation 1). SO42- → SO4- + e- (1) Some of these electrons moving through the crystal possess sufficient energy to decompose SO42- groups by collisions (equation 2). SO42- → SO3- +O- (2) The products of this decomposition (SO3- and O-), however, will only be stable in the lattice in the presence of substitutional K+, which may bind the O-; otherwise, they will immediately recombine to form SO42-. Most of the electrons are eventually recaptured by hole centers, reversing equation 1, or as shown in equations 3 and 4 (several other similar equations could be relevant as well).
SO4-
+ e- →
SO3-
+O- (3) Some electrons may also be responsible for decomposing SO3- (equation 5), though the products of this reaction (as of equation 3) will again only be stable in the presence of K+. A small number of electrons may occupy vacancies or become associated with alkali ions to produce the weak electron-excess center reported by Gromov et al. (1974). The actual "trapping" of the hole centers is related primarily to the particular configuration of the crystal field around the potassium ions. Note that the proposed model is not that of conventional color center production, where equal numbers of trapped electrons and trapped electron holes are produced. Instead, trapped hole centers are predominately produced, while most of the electrons freed during irradiation are recaptured to form more hole centers (equation 3) or non-paramagnetic groups such as SO42- or SO32- (equations 1 and 4).
Thermal bleaching occurs when lattice vibrations (and possibly thermally-activated diffusion) reach a sufficient magnitude to recombine the hole centers (such as O- and SO3- to form SO42-). Some of the energy released during this recombination is as photons (thermoluminescence); the rest is in the form of lattice vibrations. Experiments are in progress to determine the kinetics of the thermoluminescence and bleaching. The explanation for the exponential, rather than linear, relation between potassium content and bleaching rate is far from clear, and is also the subject of current investigation. A possible explanation is that K+ ions may not substitute for Sr2+ ions at random, but instead may tend to cluster together, affecting the activation energy and activation entropy of hole-center trapping. The degree of clustering may vary rapidly as a function of the total potassium content, and the potassium content could thus have a large effect on the bleaching rate. The relation between potassium content and the intensity of color when saturated is probably only linear, however. Some possible reasons that coexistent La3+ or Cl will quench the sensitivity to radiation-induced coloration are also apparent. The ion La3+ has virtually the same ionic radius as Sr2+, and may substitute for Sr2+ in sites adjacent to K+, to minimize local charge imbalance. With the charge locally balanced in this way, the color-producing hole centers have no sites in which to be trapped, and are unstable. Without these centers the celestite remains colorless. The ion Cl- produces a quenching effect possibly by substituting for SO42- in sites adjacent to K+. This again minimizes local charge imbalance and eliminates trapping sites for the paramagnetic centers. A similar substitution apparently occurs in scapolite. As to the natural source of radiation to produce the blue color, over millions of years even the lowest levels of radiation would be sufficient. Additionally, radium has a high chemical affinity for strontium, and Yuskin (1972) has found some radioactive celestite in the USSR with up to 8.4 X 10⁻⁸ percent radium. Orange celestite The orange color in the studied specimens appears to be associated with the presence of copper. The color is thermally stable, and has an absorption spectrum entirely different from that of blue celestite. The color is most likely due to the presence of Cu+. In free Cu+, the absorption for the transition 3d10 → 3d94s occurs as a multiplet in the region 2.7-3.3 eV (380-460 nm) (Moore, 1952). This is the region of intense absorption observed in the orange celestite. The color of cuprite, Cu2O, is probably due to this mechanism as well. The very low amounts of K and Na in the uniformly orange specimen LB 10 account for the insensitivity of this specimen to radiation-induced coloration. The orange specimen LB 5 contains more Na and K, and indeed is bluish in places. Green celestite Greenish celestite is sometimes reported in the literature. All of the greenish zones observed in this study are due to the presence of sulfur inclusions (sulfur being a common associate of celestite, especially in Sicily and Maybee, Michigan) in otherwise blue crystals. These inclusions are easily observed under 50X magnification. The combination of the blue celestite with the yellow sulfur inclusions produces the green appearance. Acknowledgments I thank David Walker for his assistance with the thermal experiments, and Robert F. Quirk for his assistance with the emission spectrograph and atomic absorption spectrometer. I am also grateful to Bruce Loefller and Kay Parkin for their assistance with the optical absorption spectrometer, and Roger G. Burns for his review of the manuscript. Special thanks are given to Clifford Frondel for his encouraging support and helpful criticism.
References Atkins, P. W. and M. C. R. Symons (1967) The Structure of Inorganic Radicals. Elsevier, New York. Bakhtin, A. I., R. A. Khasanov and V. M. Vinokurov (1973) Electron paramagnetic resonance and optical absorption spectra of some defect centers in barites and celestites. Sostav. Strukt. Svoista Mineral., 84-90. Bershov, L. V. and A. S. Marfunin (1967) Paramagnetic resonance of electron-hole centers in minerals. Dokl. Akad. Nauk SSSR, 173, 410-412. Burns, R. G. (1970) Mineralogical Applications of Crystal Field Theory. University Press, Cambridge. Doelter, C. (1915) Die Farben der Mineralien. Fried. Vieweg und Sohn, Braunschweig, Germany. Friend, J. N. and J. P. Allchin (1939) Colour of celestine. Nature, 144, 633. _______ and (1940) Colloidal gold as a colouring principle in minerals. Mineral. Mag., 25, 584-596. Gromov, V. V. and J. R. Morton (1966) Paramagnetic centers in irradiated potassium sulfate. Can. J. Chem., 44, 527-528. _______, L. N. Ivanov and T. Kwan (1974) Ion radicals in celestite crystals. Radiokhimiya, 16, 404-409. Hogarth, D. D. and W. L. Griffin (1976) New data on lazurite. Lithos, 9, 39-54. Isetti, G. (1970) Studio sulla colorazione della celestina. Doriana, 4, no. 194, 1-7. Khasanov, R. A., N. M. Nizamutdinov and V. M. Vinokurov (1973) Electron paramagnetic resonance of hole centers in celestite single crystals. Sostav. Strukt. Svoista Mineral., 79-83. Lewis, W. K., L. Squires and G. Broughton (1942) Industrial Chemistry of Colloidal and Amorphous Materials. Macmillan, New York. Loefiler, B. M. and R. G. Burns (1976) Shedding light on the color of gems and minerals. Am. Scientist, 64, 636-647. Moore, C. E. (1952) Atomic energy levels. U. S. Natl. Bur. Stand. Circ. 467, v. 2, 115-118. Morton, J. R. (1965) Electron spin resonance spectra of S2O 2 in irradiated thiosulfate single crystals. Can. J. Chem., 43, 19481951. _________ (1969) The origin of the blue colour and paramagnetism of ultramarine. Colloque Ampere, 15, 299-303. Przibram, K. (1956) Irradiation Colours and Luminescence. Pergamon, London. Samoilovich, M. I. (1971) Study of sulfur-containing ion-radicals in minerals studied by the EPR method. Geokhimiya, 4, 477-483. ________, A. I. Novozhilov, L. V. Bernov and N. I. Andrusenko (1968) EPR in irradiated strontium sulfate single crystals. Radiokhimiya, 10, 506-507. ________ V. M. Radyanskii, A. G. Davydchenko and S. A. Smirnova (1973) Nature of the blue color of lazurite. Izv. Akad. Nauk SSSR, Ser. Geol., no. 7, 95-102. Schulman, J. H. and W. D. Compton (1962) Color Centers in Solids. Macmillan, New York. ________, R. J. Ginther and R. D. Kirk (1952) Enhancement of X-ray induced absorption bands in alkaline earth compounds. J. Chem. Phys., 20, 1966-1967. Stromeyer, F. (1821) Untersuchungen über Mischung der Mineralkörper, vol. 1. Vandenhoeck und Ruprecht, Gottingen. Vendl, A. and T. Mandy (1958) über die blaue Farbe einiger Mineralien. Acta Mineral. Petrog. Univ. Szeged., 11, 61-67. Weinhold, C. (1864) Bemerkungen über das Pigment des Cölestins von Jena. Arch. d. Pharmacie, II Reihe, 119, 4-8. Wittstein, G. C. (1856) Ueber die Ursache der blauen Farbe des Coelestins. Vierteljahresschrift für Praktische Pharmacie, 5, 286287. Yuskin, N. P. (1972) Geochemistry of radium and uranium during sulfur deposition. Tr. Inst. Geol. Akad. Nauk SSSR, Komi Filial, no. 12, 73-80.
Manuscript received, March 13, 1978; | |||||||||||||||||||||||||||||||||||||||||||||||||||||||||||||||||||||||||||||||||||||||||||||||||||||||||||||||||||||||||||||||||||||||||||||||||||||||||||||||||||||||||||||||||||||||||||||||||||||||||||||||||||||||||||||||||||||||||||||||||||||||||||||||||||||||||||||||||||||||||||||||||||||||||||||||||||||||||||||||||||||||||||||||||||||||||||||||||||||||||||||||||||||||||||||||||||||||||||||||||||||||||||||||||||||||||||||||||||||||||||||||||||||||||||||||||||||||||||||||||||||||||||||||||||||||||||||||||||||||||||||||||||||||||||||||||||||||||||||||||||||||||||||||||||||||||||||||||||||||||||||||||||||||||||||||||||||||||||||||||||||||||||||||||||||||||||||||||||||||||||||||||||||||||||||||||||||||||||||||||||||||||||||||||||||||||||