| Home | AmMin | GMR | RiMG | Collectors Corner | Directory | Short Courses | |
|
|
|||||||

|
|
Volume 67, pages 356-359, 1982
Monazite from North Carolina having the alexandrite effect LAWRENCE R. BERNSTEIN Stanford, California 94305 Abstract Monazite crystals from a 50 m wide quartz vein in Montgomery County, North Carolina show the alexandrite effect. The crystals are reddish-orange under incandescent light, yellow-orange in daylight, and light green under fluorescent light. The colors are due to narrow absorption bands from Nd 3+ at about 800, 745, 580, 525, and 515 nm, and an absorption edge beyond ~=480 nm. The monazite is chemically unusual in containing virtually no Th, U, or iron-group elements, which can cause deep colors that mask the pastel rare earth-produced colors. The alexandrite effect in this monazite differs from that in previously described substances in being due to several narrow absorption bands rather than a small number of broad bands.Introduction The alexandrite effect is the property of a solid to change its apparent color when viewed under different commonly-observed "white" light sources. The effect is best known in alexandrite, a chromian chrysoberyl that appears green in sunlight or fluorescent light and red in incandescent or candle light. Other materials known that can show an alexandrite effect are: Cr3+ or V3+ bearing corundum and garnet (White et al., 1967; Schmetzer et al., 1980); Sm 2+ and Y3+ bearing fluorite (Schmetzer et al., 1980); coquimbite (Rossman, 1975); spinel (G. R. Rossman, oral communication, 1981); and diaspore (Scarratt, 1980). The optical spectra of these colorchanging materials have been found to have an absorption maximum between 580 and 560 nm with flanking minima between 665 and 625 nm and between 510 and 470 nm.This study presents optical and chemical data on monazite crystals from North Carolina that show the alexandrite effect. The causes of the color and the color-change effect are discussed and are compared to those in other color-changing materials. Samples used and occurrence Specimens used in this study were collected by Ronald and Margaret Yadusky of Fayetteville, North Carolina, who brought the color-changing mineral (then an unknown) to my attention. The specimens are from an unnamed quartz (or perhaps gold) prospect located in the Uwharrie National Forest, at the south end of National Forest Road 555, 8.4 km east of Badin, Montgomery County, N. C. The prospect is in a 50 meter wide quartz vein in the Ordovician slates- of the Carolina slate belt. Vugs in the quartz contain milky gray to transparent quartz crystals up to 15 centimeters long. The vugs sometimes contain small euhedral crystals (a few mm or less) of anatase, brookite, ilmenite, hematite, barite, feldspar, rutile, and monazite. Pyrite, spessartine, rutile, and chlorite occur as inclusions in the quartz. The monazite crystals observed in this study are euhedral, 1-2 mm long and 0.3-0.7 mm wide. They occur on a vug surface that consists of coalesced subhedral gray quartz crystals up to 10 mm across in parallel growth. Euhedral dipyramids of brown to black anatase, 1-2 mm long and 0.3-1 mm wide also occur on the vug surface, as do limonite crusts and small (1-3 mm) microcline crystals. The monazite crystals appear yellow-orange in daylight, reddish-orange in incandescent light, and light green in fluorescent light. No pleochroism was observed in the polarizing microscope, and no fluorescence was observed under shortwave or longwave ultraviolet radiation. Tiny brown inclusions, several dozen microns across, are seen under the microscope and were not identified. Table 1. Quantitative microprobe analyses of monazite having the alexandrite effect from Montgomery County, North Carolina.
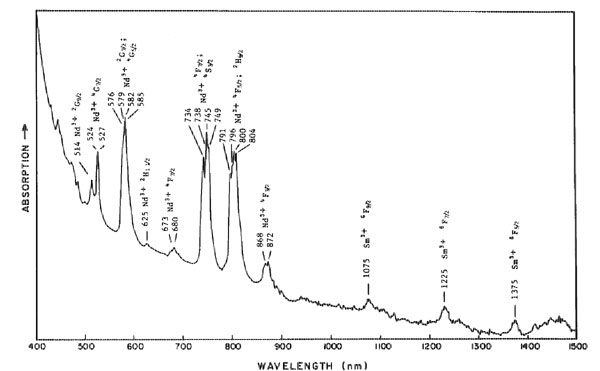
n.d. = not detected Looked for but not detected: Al, Dy, Er, Fe, Hf, Ho, Mg, Mn, Na, Nb, Ph, Ta, Ti, U, Yb, Zr. *Calculated on basis of the sum of all cations = 2.000 **Estimated from semiquantitative wavelength-dispersive microprobe scan Experimental methods The color-changing crystals were initially identified as monazite by powder X-ray diffraction. The identification was substantiated by a wavelength-dispersive microprobe scan for major and minor components. Quantitative chemical anlayses were made using the MAC 5-SA3 automated microprobe at the California Institute of Technology. The microprobe was operated at 15 kV and 0.05 pA. Two inclusion-free points were analyzed, the first near the rim of the crystal and the second in the central part. Lanthanide-group and yttrium standards were a set of four synthetic glasses prepared by Peter Weill containing these elements at about the 4% level, grouped to avoid mutual interferences. Other standards included: Si-quartz; Ca-wollastonite; P, F-apatite; Na-Amelia albite. Optical absorption spectra were obtained on a Cary 171 spectrometer at the Division of Geological and Planetary Sciences at C. I. T. Illumination used was in the range 360 to 1500 nm, at room temperature. The sample used was a nearly inclusion-free portion of a plate, 300 x 200 x 180 µm thick, polished on both sides. Results Chemistry The microprobe scan detected major P, Ce, La, and Nd, with minor Sm and Pr, and traces of Eu and Si. Although Th, U, and Fe-group metals were sought, being common constituents of monazite, none were found. A portable scintillation counter detected no radioactivity in the sample. The results of the quantitative microprobe analysis are presented in Table 1. Again, no U or Fe-group metals were detected, though a trace of Th may have been detected in one of these analyses. Optical absorption spectrum The narrow-band spectrum obtained for the monazite in unpolarized light is shown in Figure 1. Major absorption bands, which all show considerable fine structure, occur at about 800, 745, 580, 525, and 515 nm, with an absorption edge becoming steep beyond ~480 nm. Some small bands occur in the near-infrared and in the near-ultraviolet. Due to the very small sample size and poor optical orientation due to crystal morphology, complete results in polarized light could not be obtained. The results that were obtained indicated little change in the absorption spectrum under different optical orientations. This is in agreement with the lack of observed pleochroism. Discussion and conclusions The monazite absorption spectrum was compared to spectra obtained from dilute trivalent rare earth solutions (Carnall and Fields, 1967) and to transition energy diagrams for RE3+ ions (Dieke and Crosswhite, 1963). Monazite bands observed in the visible range were readily attributable to Nd3+, while some of the small bands observed in the infrared (>1000 nm) are due to Sm3+. The narrow absorption bands from these trivalent rare earths are due to parity-forbidden transitions in the 4f subshell. The transitions become allowable due to noncentrosymmetric interatomic and crystal field effects on the ions, which also produce most of the fine structure within the bands. The "shielding" of the unfilled 4f subshell by the filled 5s and 5d subshells greatly lowers the interatomic and crystal field effects on the 4f transitions, producing the relatively narrow bands. Due to the "shielding", the bands for a given RE3+ ion vary in position only by about 10 to 100 cm -1 among various crystals and solutions (Marfunin, 1979, p. 203). The absorption edge extending into the visible may be due to metal-metal or metal-oxygen charge-transfer transitions.Monazite crystals usually contain at least 3 to 12% ThO2 and often up to 1.5% Fe 2O3. Traces of U are also often present. Radiation damage by the Th and U, or absorptions by the iron-group ions, often make monazite dark colored, masking the pastel colors caused by the RE3+ ions. The monazite of this study is unusual in that it contains virutally no Th, U, or first transition group elements. Thus its color and alexandrite effect are a result of the RE3+ elements alone, specifically Nd3+.
The monazite absorption spectrum is consistent with that of other described color-changing materials in having absorption maxima and minima roughly in the ranges earlier specified. The spectrum differs in having substantially narrower absorption bands than for previously published spectra (e.g., Schmetzer et al., 1980) of color-changing minerals. A similar color-change phenomenon was observed by Weyl (1951, p. 223) in Nd3+ colored glass. The optical-physiological causes of the alexandrite effect have been discussed by several authors (e.g., Poole, 1964; White et al., 1967; Schmetzer et al., 1980). The effect is due to a substance having optical absorption bands that are close to critical wavelength boundaries that determine a person's perception of different colors. Slight differences in the wavelength composition of different illuminators are sufficient to change the color perceived. The monazite described in this study demonstrates that narrow absorption bands are sufficient to produce this effect. Acknowledgments I thank Dr. George R. Rossman of the California Institute of Technology for use of, and assistance with, the optical absorption spectrometer and for a critical reading of the manuscript. I also thank Dr. James Woodhead of Cal Tech for the microprobe work, and Stanford University for use of their X-ray diffraction equipment. I am grateful to Ronald and Margaret Yadusky of Fayetteville, North Carolina for bringing this mineral to my attention. References Carnall, W. T. and Fields, P. R. (1967) Lanthanide and actinide absorption spectra in solution. In P. R. Fields and T. Moeller, Eds., Lanthanide/Actinide Chemistry (Advances in Chemistry Series no. 71), p. 86-101. American Chemical Society, Washington, D. C. Dieke, G. H. and Crosswhite, H. M. (1963) The spectra of doubly and triply ionized rare earths. Applied Optics, 2, 675686.Marfunin, A. S. (1979) Spectroscopy, luminescence and radiation centers in minerals. Translated by V. V. Schiffer. Springer-Verlag, New York. Poole, C. P. (1964) The optical spectra and color of chromium containing solids. Journal of Physics and Chemistry of Solids, 25, 1169-1182. Rossman, G. R. (1975) Spectroscopic and magnetic studies of ferric iron hydroxy sulfates: intensification of color in ferric iron clusters bridged by a single hydroxide ion. American Mineralogist, 60, 698-704. Scarratt, K. (1980) Faceted diaspore. Journal of Gemmology, 17, 145-148. Schmetzer, K., Bank, H. and Gübelin, E. (1980) The alexandrite effect in minerals: chrysoberyl, garnet, corundum, fluorite. Neues Jahrbuch für Mineralogie Abhandlungen, 138, 147-164. Weyl, W. A. (1951) Coloured Glasses. Society of Glass Technology, Sheffield, England. White, W. B., Roy, R. R. and Crichton, J. M. (1967) The "alexandrite effect": and optical study. American Mineralogist, 52, 867-871. Manuscript received, August 10, 1981; accepted for publication, November 16, 1981.
|
||||||||||||||||||||||||||||||||||||||||||||||||||||||||||||||||||||||||||||||||||||||||||||||||||||||||||||||||||||||||||||||||||