| Home | AmMin | GMR | RiMG | Collectors Corner | Directory | Short Courses | |
|
|
|||||||

|
|
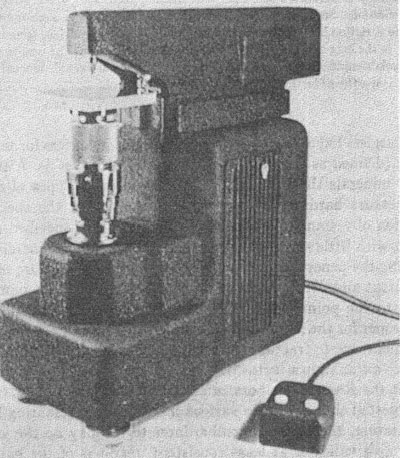
Volume 30, pages 583-595, 1945 THE KNOOP MICROHARDNESS TESTER AS A MINERALOGICAL TOOL1 HORACE WINCHELL 2ABSTRACT The Tukon testing machine with a Knoop indenter has useful possibilities in the measurement of hardness of mineral specimens. Not only does the instrument afford numerical hardness values such as argentite=25, calcite=100, fluorite=150, magnetite=700, corundum=2000, SiC=3000, and diamond=about 8000, but it repeats these numbers with an accuracy of between 2 and 5 per cent when applied to a given crystal face under constant conditions. Surprisingly large variations of hardness have been found in many crystals, the variation being a function of the orientation of the surface tested and of the orientation of the long axis of the Knoop indenter in that surface. The results of 479 tests in 92 different orientations on 16 different minerals and mineral-like substances indicate the instrument is worthy of further study as a mineralogical tool. INTRODUCTION Metallurgists have long used various types of indenters for testing the hardness (defined as resistance to deformation) of metals. Attempts to apply to minerals the Rockwell, Vickers, and other types of machines which measure hardness in terms of deformation of the specimen by penetration of a standard-shaped point applied by a specified machine, have met with little success because of the tendency of minerals to fracture during the penetration of the indenter. Since the fracture represents displacement and deformation of other material than that immediately adjacent to the point of the indenter, greater penetration takes place than is proper for the indenter and its associated machine. Moreover, the displacement due to fracture cannot be measured readily, and therefore introduces an unknown factor into the measurement. Experiments conducted at the Research Laboratories of the Hamilton Watch Company have suggested that of all the various machines for measuring hardness by indentation, the Knoop microhardness tester may be the only tool that can give valid, or at least consistent, readings of the hardness of minerals. THE KNOOP INDENTER Knoop, Peters, and Emerson (1939) described an unusually sensitive pyramidal-diamond indenter which is known as the microhardness tester, or Knoop indenter. The Wilson Mechanical Instrument Company manufactures a machine, the Tukon tester (Fig. 1), which utilizes this indenter. In measuring the hardness of a specimen, a polished flat surface is first prepared. The Knoop indenter is then brought into contact with this surface for 20 seconds (the minimum time found adequate to assure consistent results), with a known load. The indentation thus produced is measured with a microscope, and the hardness number I is proportional to the load - divided by the area of the indentation. For relatively heavy loads - say 1 to 3 kilograms-the hardness number is essentially independent of the load. Tate (1944) showed, however, that this is not strictly true for loads of 100 grams or less; he concluded that the applied load should always be reported with the hardness number: that practice is followed here. The Tukon tester is provided with several weights corresponding to loads from 100 grams up. Our instrument is not provided with smaller loads, but slight changes could easily be made which would accomplish the purpose if necessary. The latest model of the Tukon testing machine embodies an electromagnetic device for applying the load without overloading by impact between the specimen and the diamond indenter. The Hamilton instrument was rebuilt to afford that protection against shock after about half of the corundum tests reported here had been completed. The error due to impact before installation of the device is believed to be mostly the result of fractures in brittle specimens, although there must have been some decrease of the hardness number due to impact of the unguarded indenter in the old form of the instrument. The tests of a fluorite specimen (Table 2) before and after rebuilding show essentially no change in hardness number due to this modification to the instrument.
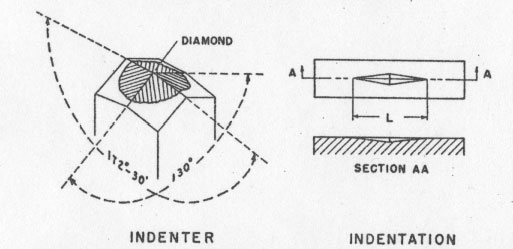
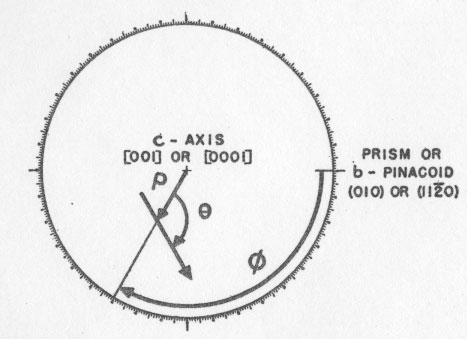
The Knoop indenter possesses certain advantages over other similar hardness measuring tools, and these are exactly the advantages that make it suitable for testing minerals. Figure 2 shows the shape of the indenter. An extremely shallow penetration is sufficient to produce an indentation long enough to be measured with a relative accuracy of about 1%. Thus, for an indentation 100 microns (0.1 mm.) long, the penetration is only about 3 microns. The smallness of the penetrtaion was demonstrated by Peters and Knoop (1940) when they showed that a valid reading of the hardness of electrolytic chromium plate can be obtained, regardless of the nature of the base metal upon which the chromium was deposited, if the thickness of the plating is greater than 0.001 inch or 25 microns. The validity of extending this conclusion to cover small grains in a polished section of a mineral assemblage is not debated here, but does not seem unreasonable for roughly equant grains which appear about 100 microns in diameter in the plane of the section, especially if several such grains are tested and found to give consistent results. By reducing the load applied to the indenter, the length of the indentation can always be kept small. CALCULATIONS The conversion of the measured length of the indentation and the load on the indenter to the hardness number is made by means of the following formula, which may be expressed by a family of parallel straight lines on logarithmic graph paper: I=W/L 2cI=Knoop hardness number. W=Load applied to the indenter, in kilograms. L=Length of the indentation, originally defined as in centimeters; but L may be measured in any length units desired and the conversion factor to centimeters may be included in c. c=a constant depending upon the shape of the indenter. It may also include conversion factors depending upon the units actually used to measure W and L. As stated above, the equation may be expressed by straight lines, one for each applicable load, on logarithmic graph paper. The scale of the graph may be made such that there will be no danger of introducing errors that are larger than probable errors inherent in the measurement of the indentation by optical methods. The form of the above equation shows that to achieve a given relative or percentage accuracy in I, L must be measured with a maximum relative or percentage error one-half as great. For example, if L is measured with an error of 1 part in 100, the resulting error in I would be 2 parts in 100. RELIABILITY To evaluate the accuracy or consistency of the Tukon tester in the laboratories of the Hamilton Watch Company, for mineral testing purposes, several specimens were tested many times each. The results will be found summarized and expressed as probable error 3 in Table 2. It was found that most hardness readings will be repeated within about 2 to 5 per cent of the average, when many indentations are made in the same orientation on the same crystal surface. The probable error of an observation or of the average of several observations is appreciably increased if any of the observations are made on indentations associated with cracks or other fractures. In accordance with logical arguments that the highest reading will be obtained with the least fracturing, it was concluded that the maximum of a series of readings should be selected if fractures appear with any of them; but the average should be considered the best value if no fractures occurred. According to that convention, the best value is indicated in Table 2 in boldface.A note of caution must be included here regarding these measures of accuracy. The "probable error" shown in Table 2 and defined above is really a measure of the self-consistency of the given set of observations. It takes no account of possible systematic errors such as the dependence of the hardness number upon the load on the indenter (Tate, 1944), or imperfectly shaped or polished indenters. "Probable errors" also do not include errors due to faulty specimen preparation (polishing, levelling, etc.) or improper adjustment of the Tukon testing machine. Our efforts were mainly to control such variables by holding them constant. We have made no attempt to determine the importance of such factors for this study. Another still undetermined source of possible error is the crystallographic orientation of the diamond indenter. So far as is known, the makers of the indenters do not attempt to hold this constant. This factor would undoubtedly be negligible for soft and medium specimens but in testing materials of great hardness, the elastic properties and hardness of the diamond itself would be of the same order of magnitude as those of the specimen, and should therefore be considered. It is our impression that such properties would vary appreciably with the orientation of the diamond. For all these reasons, then, the reader is cautioned not to accept uncritically the fourth, nor even the third significant figures of the hardness numbers quoted in Table 2. The probable error alone (2% to 5%) would generally indicate that the fourth digit can have little significance. Nevertheless, until full information on validity of results is available from all sources, it seems best not to round off the numbers farther than to the nearest 5 units in the fourth significant figure. This consideration probably would not affect results for soft materials, but might noticeably affect those reported for materials of greater hardness than 1000. SPECIFICATION OF ORIENTATION To correlate hardness numbers with orientation of the test surface and of the long axis of the indenter in that surface, three independent coordinate angles are necessary. These angles may be compared with longitude, colatitude, and azimuth or bearing on the surface of the earth. The two-circle goniometer studies of Goldschmidt, Palache, and others (Dana-Palache et al. 1944, pp. 3-37) form the basis for the definition of the orientation coordinates of the surface tested: "longitude" =phi (φ) "colatitude" or polar distance= rho (ρ).
The azimuth or bearing, designated theta (θ), is measured clockwise from the
north or meridian direction to the long axis of the indenter. Figure 3 shows
these angles in stereographic projection. Phi (φ) is measured
clockwise about the fundamental circle of the projection from the point
representing the plane (010) or (11
It will be evident that these definitions permit choosing the following ranges for the three coordinate angles:
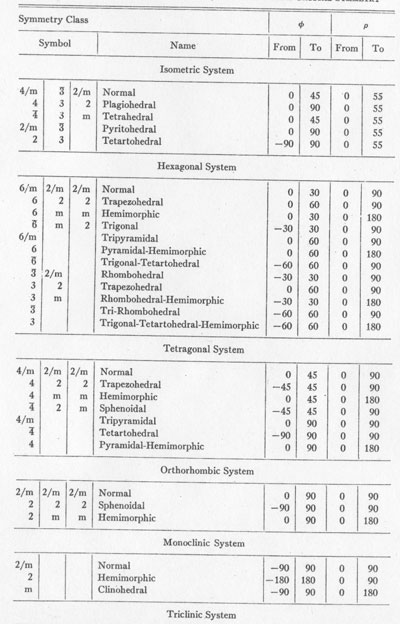
-180° < φ <=180° However, φ and ρ may be limited to smaller values by taking into consideration the symmetry of the applicable crystal class, as shown in Table 1. Also θ may be limited to smaller values by the twofold symmetry axis of the indenter itself, and also to special values if the test plane is normal to certain symmetry planes or to an axis of higher symmetry in the crystal. In general, 0° <= θ < 180°, because of the symmetry of the indenter only. Graphical calculations leading to the expression of the coordinates are not difficult for most crystals. They are most easily carried out by means of gnomonic or stereographic projections based upon Laue back-reflection x-ray patterns made with the test plane parallel with the x-ray film and normal to the x-ray beam. The position of the long axis of the indentation must be noted with respect to the top or other mark on the x-ray film at the time of setting up for the diffraction pattern; otherwise θ may be lost. In hexagonal and tetragonal crystals, the extinction angle may be measured by polarized light to determine θ, provided the specimen is transparent and in a suitable mounting.
THE KNOOP MICROHARDNESS TESTER TABLE 1. LIMITS OF VARIATION OF φ AND ρ RESULTING
FROM CRYSTAL SYMMETRY
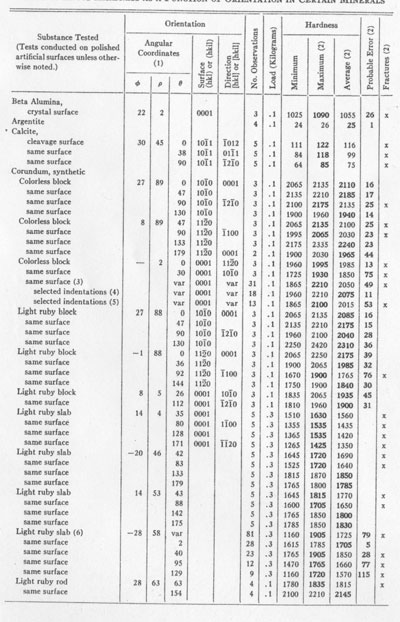
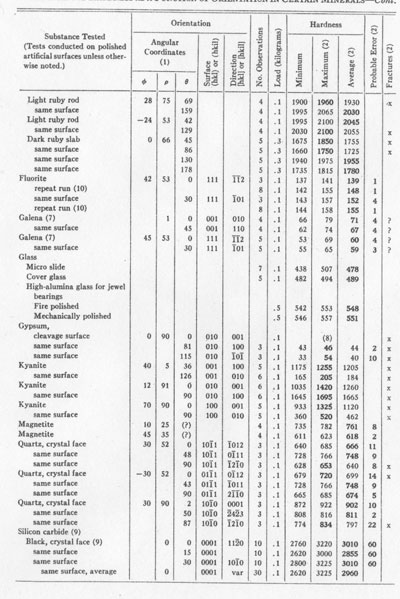
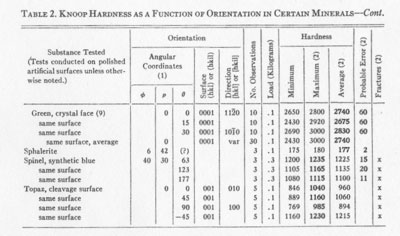
TABLE 2. KNOOF HARDNESS AS A FUNCTION OF ORIENTATION IN CERTAIN MINERALS
NOTES TO TABLE 2 (1) Angular coordinates are as defined in Fig. 3 and as measured by means of x-ray diffraction patterns (2) In the column headed Fractures is indicated the presence of small fractures observed about the marks of the indenter. If fractures were present, the maximum hardness reading of a series is considered the best, and is so indicated by boldface numerals, but if no fractures were observed, the average is considered the best value obtainable from the series, and is so indicated by the same means. The probable errors were calculated for the maximum or for the average, whichever is considered best value. (3) Indentations in 31 different directions. (4) Selected indentations with no fractures. (5) Selected indentations with minor fractures. (6) Combined results from the following four items. (7) No fractures visible, but fractures probable on account of the excellent cleavage. (8) Large fractures; measurements impossible at lightest available loads (0.1 Kg). (9) Probable errors for silicon carbide observations are approximate. (10) Original measurements August, 1942. Repeated January, 1945, because of question raised by comparison with published results (Table 3), and to observe effect of addition of magnetic device for preventing indenter-overload due to impact.
RESULTS OF TESTS Table 2 contains the collected results of mineral hardness determinations made at the Hamilton Watch Company laboratories over a period of approximately 3 years. Bearing in mind the rather academic importance of most of these results, the reader will understand why more extensive tests cannot easily be made here. This list does include a wide enough variety of minerals and mineral-like materials to indicate very promising possibilities for application of the Knoop indenter to determinative mineralogy and to crystallography. Several type-minerals in Mohs' scale, and some in the scale of hardness of Talmage (1925), are included in Table 2. It should be emphasized that determinations from fractured indentations marked "x" were of a reduced order of accuracy because of the fractures. Such determinations should not be considered final nor necessarily even approximately accurate; they are the best we have available, however, and it will be noted that even in spite of the uncertainty introduced by the presence of fractures, the fractures themselves appear to have been fairly consistent for any given orientation, and the readings therefore were fairly constant. Analysis of the table will show that the largest probable error for a good determination is less than 5% of the hardness number. It is especially to be noted that most of the substances tested in several orientations showed considerable variations of hardness with orientation. The well-known variation of scratch-hardness with scratch direction on the macropinacoid of kyanite is reflected by variations obtained by indenting that surface with the indenter either parallel to, or at right angles to the direction of the c-axis. If we consider the direction of scratching and the azimuth of the indenter for the highest hardness value observed on the surface tested, we note a discrepancy as follows: Azimuth (B) for maximum hardness in kyanite
No explanation of this apparent anomaly can be offered here. It may be due to the excellent cleavage of the mineral, and it may be due in part to the fractures that were produced in the material by the indenter. COMPARISON WITH RESULTS OF OTHERS So far, only a few investigators have reported any findings regarding the applicability of the Knoop microhardness tester to mineral specimens. Knoop, Peters, and Emerson (1939), and Peters and Knoop (1940) published a few mineral hardness tests in their early descriptions of the instrument. Table 3 shows the mineral hardness values quoted by them, together with results obtained here. Our results (Table 2) suggest that the ranges indicated are real, and may be due to the variations of hardness with crystallographic orientation: since they do not represent a complete exploration of all orientations, it is likely that they should be even wider than indicated. Differences between our results and those of the Bureau of Standards appear to be real, possibly instrumental differences, but they are probably due in part to orientation differences. Some differences may be due also to the use of indentations with small fractures. TABLE 3. COMPARISON OF KNOOP MICROHARDNESS NUMBERS
* Variation due at least in part to orientation of different test surfaces and/or different positions of indenter therein. ¦ Topaz determinations at Hamilton probably low on account of fractures. ACKNOWLEDGMENT Grateful acknowledgment is due the Hamilton Watch Company for support of this work, and for the use of the Tukon tester. Special credit is due Mr. G. E. Shubrooks, Chief Chemist and Metallurgist, and Mr. J. H. Swarr, Metallurgist, for their cooperation and interest in the project. Mr. Swarr conducted or supervised nearly all the tests reported here, often under conditions made difficult by the tendency of the minerals to fracture excessively under all but the lightest loads. The Wilson Mechanical Instrument Company, New York, kindly furnished the photograph of the Tukon Tester which is reproduced as Fig. 1. The critical comments of Dr. N. W. Thibault of Norton Company, Worcester, are hereby acknowledged. Dr. Thibault's reading and criticism of the manuscript has led to clarification of several points that otherwise could easily have been misunderstood. Statements of fact or opinion, however, are the writer's, and do not necessarily reflect Dr. Thibault's views.
CONCLUSION The Knoop microhardness tester, embodied in the Tukon testing machine, is a new mineralogical tool which appears to deserve further investigation. This tool is apparently capable of detecting and measuring variations in hardness on different crystal faces of corundum, magnetite, calcite, and other materials. It shows some unexplained anomalies when applied to kyanite, which is a mineral noted for its hardness variations. Kyanite shows hardnesses ranging from 205 to 1700, depending upon the orientation of the test surface, and of the long axis of the Knoop indenter in that surface. The Knoop hardness of gypsum is approximately 32 to 45 or more, depending upon orientation; that of calcite is 75 to 135; that of fluorite, 140 to 150; of orthoclase, 560; of quartz, 666 to 900; of topaz, 1250; of corundum, 1700 to 2200; and of diamond, about 8000. The instrument reproduces its own results within an accuracy of 2% to 5%, depending upon the hardness and brittleness of the specimen, and such accuracy can be achieved in testing grains only 100 microns in diameter in polished sections. BIBLIOGRAPHY BRODIE, CONSTANCE B. (1944), The microhardness tester as a metallurgical tool: Trans., Am. Soc. Metals, 33, 126. DANA-PALACHE ET AL. (1944), Dana's System of Mineralogy, Part I, by C. Palache, H. Berman, and C. Frondel. New York, (1944). KNOOP, F., PETERS, C. G., AND EMERSON, W. B. (1939), Sensitive pyramidal-diamond tool for indentation measurements: U. S. National Bureau of Standards, Research Paper No RP1220; the Bureau's Journal of Research, 23, July, 1939, 39-61. PETERS, C. G., and KNOOP, F. (1940), Metals in thin layers - Their microhardness: Metals and Alloys, 13, 292. TALMAGE, S. B.. (1925), Quantitative standards for hardness of the ore minerals: Econ. Geol., 20, 531-553. TATE, D. R. (1944), A comparison of microhardness tests: Trans., Am. Soc. Metals (1944 Preprint 1, available from Society headquarters). NOTES 1 Contribution from the Research Engineering Division, Hamilton Watch Company, Lancaster, Pennsylvania. 2 Research crystallographer, Hamilton Watch Company, Lancaster, Pennsylvania. 3 If n observations of a quantity are represented by x1, x2, ······, xn, and their mean by x(bar), and their respective deviations from x(bar) by di, then the probable error of any individual observation is 0.6745(Σd 2i/(n-1))1/2 and the probable error of the mean is 0.6745(Σd2i/n(n-1))1/2.
|
|||||||||||||||||||||||||||||||||||||||||||||||||||||||||||||||||||