| Home | AmMin | GMR | RiMG | Collectors Corner | Directory | Short Courses | |
|
|
|||||||
|
|

|
Volume 76, pages 1479-1484, 1991
Origin of color in cuprian elbaite from São José de Batalha, Paraíba, Brazil GEORGE R. ROSSMAN Division of Geology and Planetary Sciences, 170-25, California Institute of Technology, Pasadena, California 91125, U.S.A. EMMANUEL FRITSCH, JAMES E. SHIGLEY GIA Research, Gemological Institute of America, 1660 Stewart Street, Santa Monica, California 90404-4088, U.S.A. ABSTRACT Gem-quality elbaite from Paraíba, Brazil, containing up to 1.4 wt% Cu has been characterized using optical spectroscopy and crystal chemistry. The optical absorption spectra of Cu 2+ in these tourmalines consist of two bands with maxima in the 695- to 940-nm region that are more intense in the EINTRODUCTION The color of elbaite has been extensively investigated. Most colors are determined by small amounts of transition elements (Dietrich, 1985). In particular, blue to green colors have been attributed to various processes involving both Fe2+ and Fe 3+ ions (Mattson and Rossman, 1987) and Fe2+ -> Ti4+ charge transfer (Mattson, as cited in Dietrich, 1985, p. 129). Cr3+ and V3+ have been identified as coloring agents in green dravite and uvite (Schmetzer and Bank, 1979) but never in elbaite. Several investigators briefly mentioned Cu2+ as a potential coloring agent in blue and green elbaite on the basis of emission spectrography analyses. For example, Warner (1935) observed that blue samples have a lower Cu concentration than yellow-green ones. On the contrary, Carobbi and Pieruccini (1946, 1947) found greater amounts of Cu in blue crystals. None of these investigators, however, proved that this ion actually acts as a coloring agent. Staatz et al. (1955) mentioned the presence of trace amounts of Cu in tourmaline but did not relate it to color.A new find of gem-quality elbaite with unusually saturated shades of green and blue colors was made in 1988. This discovery took place at an undescribed locality called Mina da Batalha ("Mine of the Battle") near the village of São José de Batalha, 4.5 km northeast of the town of Salgadinho, in the state of Paraíba, northeastern Brazil (G. Becker, B. Cook, and D. Epstein, personal communication, 1989). These elbaite samples are unique because of their Cu content (up to 2.4 wt% CuO; Bank et al., 1990; Fritsch et al., 1990), higher than any previously reported, and their spectacular colors. Cu2+ has been proposed as a coloring agent for this material (E. Fritsch, cited in Koivula and Kammerling, 1989; Bank et al., 1990). The purpose of this article is to characterize the chemical composition and optical absorption spectra of these tourmalines and to demonstrate that Cu is mainly responsible for their color. Elbaite from São José de Batalha is reportedly found in a small, decomposed granitic pegmatite (formerly prospected for manganotantalite). The associated quartz, altered feldspar, and lepidolite have not been characterized. Most of the tourmalines occur as crystal fragments weighing less than a gram, although pieces large enough to produce faceted gemstones up to 33 carats (6.6 g) have been found. In rare instances, small crystals are recovered. These elbaite samples are found in a range of color from violet-blue, not unlike the color of a blue sapphire, to green-blue, reminiscent of turquoise, and to yellowish green. The deep blue material is referred to locally as "heitorite," in honor of Heitor Dimas Barbosa, founder of COGASBRA, the mining cooperative working the deposit. Some of the complete crystals contain a deep pink core surrounded by a blue zone and a thin pink rim. Other color-zoning patterns have been observed. Because of their attractive color, these elbaite samples have proved very popular as gemstones and have commanded prices up to ten times higher than those paid for other colors of gem tourmalines in the same size and clarity range. A brief gemological description of the Paraíba tourmaline locality is given in Fritsch et al. (1990). MATERIALS AND METHODS Three crystal fragments and two faceted samples, representative of the color range of the tourmaline found at Rio Jose de Batalha, were studied in detail. These five specimens were selected on the basis of their color and color homogeneity from several hundred fragments of this material. The crystallographic orientation of the crystal fragments was determined using striations (parallel to the c axis, or optic axis) on the prism faces. When striations were not present, the samples were oriented by X-ray alignment photography. Each specimen was cut with a microsaw to obtain a parallel-windowed section containing the optic axis. The sections were then ground to an appropriate thickness (0.2-5 mm) and polished with 1-µm alumina powder. Optical absorption spectra were recorded using a Cary model 171 spectrophotometer with calcite polarizers. Chemical analyses were obtained from the same specimens with a JEOL model 733 electron microprobe. X-ray diffraction measurements to confirm the identity of the five specimens were performed with an automated Rigaku powder diffractometer operated at 35 kV and 15 mA. TABLE 1. Properties of cuprian elbaite from São José de Batalha, Paraíba, Brazil
* Color of a 1.5-mm slice containing the c axis.
The color of each of the five specimens appears homogeneous when the polished sections are viewed with the naked eye. Color descriptions are given in Table 1, using the terminology of the Munsell Book of Color (1979) and Kelly and Judd (1976). The color was visually determined on parallel-polished slices about 1.5 mm thick containing the c axis. Because of tourmaline's strong pleochroism, the face-up color of faceted gemstones might be significantly different from the descriptions reported in Table 1. The colors of the slices range from light yellowish green to light purplish blue, the sample with the highest Cu content being brilliant bluish green. RESULTS Physical properties The ranges of indices of refraction of the five specimens measured with a GIA GEM Instruments Duplex II refractometer and a filtered, near-monochromatic Naequivalent light source are ε = 1.618-1.621 (±0.001) and ω = 1.638-1.646 (±0.001). These values are typical of elbaite (Dietrich, 1985). All specimens have a uniaxial negative optical character. The birefringence ranges from 0.018 to 0.025; these values are toward the high end of the recorded range for elbaite (Dietrich, 1985). These elbaite samples are distinctly pleochroic, with the most saturated color seen along w (see Table 1). Their specific gravity, measured by the hydrostatic method in H 2O, ranges from 3.05 to 3.12 (±0.01), which is slightly higher than for most elbaite (2.84-3.10; Dietrich, 1985). None of the samples tested contained inclusions of foreign, possibly heavier minerals, as determined by microscopic examination at 80x magnification.X-ray diffraction Measured lines in the X-ray diffraction patterns of these tourmalines are closely related in both position and relative intensity to those from the pattern of a representative elbaite sample (1986 JCPDS Mineral Powder Diffraction File 26-964). Least-squares refinement of data for the most Cu-rich of the five specimens (sample R030) yielded unit-cell dimensions of a = 15.883(4) and c = 7.111(1) Å. The five strongest lines in this pattern are 3.978(56)(220), 3.445(76)(012), 2.938(100)(122), 2.567(90)(051), and 2.029(54)(152). No significant differences were noted between the diffraction patterns of this and the other elbaite specimens from this locality. The a and c dimensions of the other specimens were within 0.02 Å and 0.03 Å, respectively, of those for sample R030. Chemical analysis Electron microprobe analyses (Table 2) show that these five tourmalines contain little or no Ti, V, Cr, or Fe and have Cu and Mn as major transition element constituents. Analyses performed at three random locations on each specimen show only very slight compositional variation, as might be expected from the fairly uniform coloration. It is also interesting to note that small amounts of Bi, Pb, and Zn were detected in each specimen. Results of site occupancy calculations based on charge balance considerations (see Table 2) indicate that Cu is present in the Y crystallographic site (using the site terminology of Correns, 1969, p. 406; Deer et al., 1986). Ultraviolet, visible, and near-infrared absorption spectroscopy
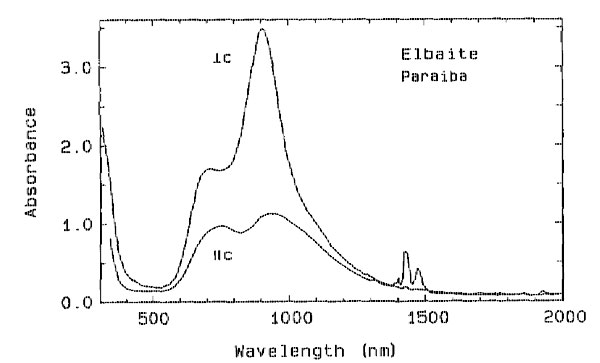
Absorption spectra were obtained at room temperature in the range from 300 to
2000 nm. The spectra of all specimens are dominated by three features - an
ultraviolet absorption edge beginning at about 400 nm (more intense in the E The absorption rising toward the ultraviolet is more conspicuous in specimens that contain a larger amount of Ti (see Table 2). Because all specimens contain much more Mn than Ti, this feature is attributed to Mn2+ - Ti 4+ charge transfer (Rossman and Mattson, 1986). In conjunction with the broad band at about 695 nm, this feature produces a greenish coloration. TABLE 2. Electron microprobe analyses of cuprian elbaite from
Paraíba,
Brazil |
| Specimen R030 | Specimen R050 | Specimen R052 | Specimen R066 | Specimen R067 | ||||||
| Wt. percent | Average | Range | Average | Range | Average | Range | Average | Range | Average | Range |
| Na2O | 2.49 | 2.47-2.50 | 2.27 | 2.24-2.31 | 2.26 | 2.20-2.37 | 2.16 | 2.15-2.17 | 2.35 | 2.32-2.38 |
| CaO | 0.05 | 0.05-0.05 | 0.46 | 0.45-0.48 | 0.55 | 0.55-0.57 | 0.62 | 0.60-0.63 | 0.47 | 0.47-0.47 |
| K2O | 0.02 | 0.02-0.03 | 0.03 | 0.02-0.03 | 0.02 | 0.01-0.02 | 0.02 | 0.02-0.03 | 0.02 | 0.01-0.02 |
| Li2O* | 1.62 | 1.62-1.62 | 1.62 | 1.62-1.62 | 1.62 | 1.62-1.62 | 1.62 | 1.62-1.62 | 1.62 | 1.62-1.62 |
| MgO | BDL | BDL-0.01 | 0.54 | 0.52-0.57 | BDL | BDL-BDL | BDL | BDL-BDL | BDL | BDL-BDL |
| TiO2 | 0.06 | 0.05-0.07 | 0.10 | 0.10-0.10 | 0.01 | BDL-0.01 | BDL | BDL-0.01 | 0.01 | BDL-0.01 |
| V2O3 | 0.01 | BDL-0.01 | 0.01 | BDL-0.01 | BDL | BDL-0.01 | BDL | BDL-BDL | BDL | BDL-BDL |
| Cr2O3 | BDL | BDL-BDL | BDL | BDL-BDL | BDL | BDL-0.01 | BDL | BDL-BDL | BDL | BDL-BDL |
| MnO | 1.48 | 1.48-1.49 | 1.47 | 1.35-1.55 | 2.30 | 2.20-2.35 | 1.32 | 1.24-1.37 | 2.55 | 2.47-2.66 |
| FeO | 0.07 | 0.06-0.10 | 0.22 | 0.22-0.23 | BDL | BDL-0.01 | BDL | BDL-BDL | BDL | BDL-BDL |
| ZnO | 0.25 | 0.24-0.26 | 0.08 | 0.07-0.09 | 0.01 | BDL-0.02 | BDL | BDL-BDL | 0.01 | BDL-0.02 |
| CuO | 1.76 | 1.75-1.79 | 0.37 | 0.34-0.39 | 0.72 | 0.70-0.73 | 0.62 | 0.60-0.65 | 0.74 | 0.73-0.75 |
| PbO | 0.01 | BDL-0.02 | BDL | BDL-0.01 | 0.01 | BDL-0.02 | BDL | BDL-BDL | 0.02 | 0.01-0.04 |
| Bi2O3 | 0.01 | BDL-0.01 | 0.39 | 0.36-0.42 | 0.11 | 0.10-0.12 | 0.15 | 0.14-0.16 | 0.08 | 0.08-0.09 |
| Al2O3 | 38.58 | 38.47-38.66 | 39.04 | 38.97-39.12 | 38.95 | 38.28-39.28 | 39.66 | 39.63-39.69 | 38.47 | 38.42-38.55 |
| B2O3* | 10.94 | 10.94-10.94 | 10.94 | 10.94-10.94 | 10.94 | 10.94-10.94 | 10.94 | 10.94-10.94 | 10.94 | 10.94-10.94 |
| SiO2 | 36.53 | 36.47-36.63 | 37.27 | 37.20-37.34 | 36.97 | 36.40-37.29 | 37.11 | 37.06-37.18 | 37.06 | 36.98-37.13 |
| H2O* | 3.13 | 3.13-3.13 | 3.13 | 3.13-3.13 | 3.13 | 3.13-3.13 | 3.13 | 3.13-3.13 | 3.13 | 3.13-3.13 |
| Cl | 0.01 | BDL-0.01 | 0.01 | BDL-0.01 | BDL | BDL-BDL | BDL | BDL-0.01 | 0.01 | BDL-0.01 |
| Subtotal | 97.02 | 97.95 | 97.60 | 97.35 | 97.48 | |||||
| -O = Cl | 0.01 | 0.01 | 0.01 | |||||||
| Total | 97.01 | 97.94 | 97.60 | 97.35 | 97.47 | |||||
| Na | 0.822 | 0.835 | 0.714 | 0.800 | 0.715 | 0.815 | 0.682 | 0.794 | 0.744 | 0.830 |
| Ca | 0.009 | 0.080 | 0.096 | 0.108 | 0.082 | |||||
| K | 0.004 | 0.006 | 0.004 | 0.004 | 0.004 | |||||
| Li* | 1.109 | 2.982 | 1.057 | 2.940 | 1.062 | 2.959 | 1.063 | 2.871 | 1.064 | 2.924 |
| Mg | 0.131 | |||||||||
| Ti | 0.007 | 0.012 | 0.001 | 0.001 | ||||||
| V | 0.002 | 0.002 | ||||||||
| Cr | ||||||||||
| Mn | 0.214 | 0.165 | 0.317 | 0.182 | 0.352 | |||||
| Fe | 0.010 | 0.030 | ||||||||
| Zn | 0.032 | 0.010 | 0.001 | 0.001 | ||||||
| Cu | 0.023 | 0.045 | 0.088 | 0.076 | 0.091 | |||||
| Pb | 0.001 | 0.001 | 0.001 | |||||||
| Al | 1.492 | 1.472 | 1.485 | 1.544 | 1.410 | |||||
| Bi | 0.002 | 0.016 | 0.004 | 0.006 | 0.004 | |||||
| Al | 6.000 | 6.000 | 6.000 | 6.000 | 6.000 | |||||
| B* | 3.229 | 3.065 | 3.078 | 3.081 | 3.085 | |||||
| Si | 5.752 | 6.000 | 6.050 | 6.026 | 6.055 | 6.054 | ||||
| Al | 0.248 | |||||||||
| OH* | 3.553 | 3.556 | 3.389 | 3.392 | 3.403 | 3.406 | 3.411 | 3.414 | ||
| Cl | 0.003 | 0.003 | 0.003 | |||||||
|
Note: Electron microprobe analyses were performed on an automated, five-crystal JEOL 733 spectrometer operating at a beam accelerating potential of 15 kV, a current of 35 nA, and spot size of between 10 and 25 µm. Kα lines were analyzed for each element except Pb and Bi, for which Mα lines were used. Standards include: (Na) = Amelia albite, (Mg) = MgO, (Al, Si) = kyanite, (K) = microcline, (Ca) = anorthite, (Ti) = TiO2, (V) = pure element, (Cr) = Cr2O3, (Mn) = manganese olivine, (Fe) = synthetic fayalite, (Cl) = sodalite, (Zn) = ZnO, (Cu) = pure element, (Pb) = galena, and (Bi) = pure element. Entries indicated by "BDL" were below the detection limits of the instrument (less than 0.01 wt%). The data were corrected using the program CITZAF (Armstrong, 1988) employing the absorption correction of Armstrong (1982), the atomic number correction of Love et al. (1978), and the fluorescence correction of Reed (1965) as modified by Armstrong (1988). Each specimen was analyzed at three different locations; the range of oxide concentrations and an average analysis are shown for each of the five elbaite samples, along with a calculated chemical formula based upon the average analysis. * Values of B2O3, Li2O, and H2O were calculated based on stoichiometry.
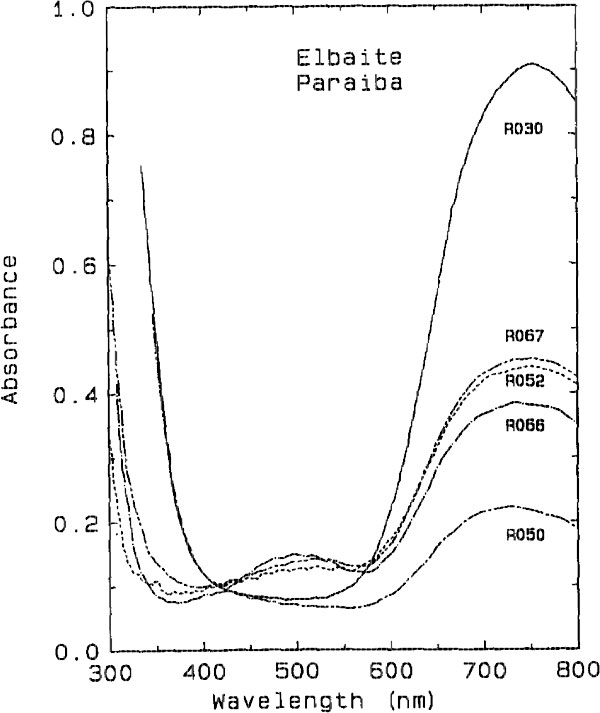
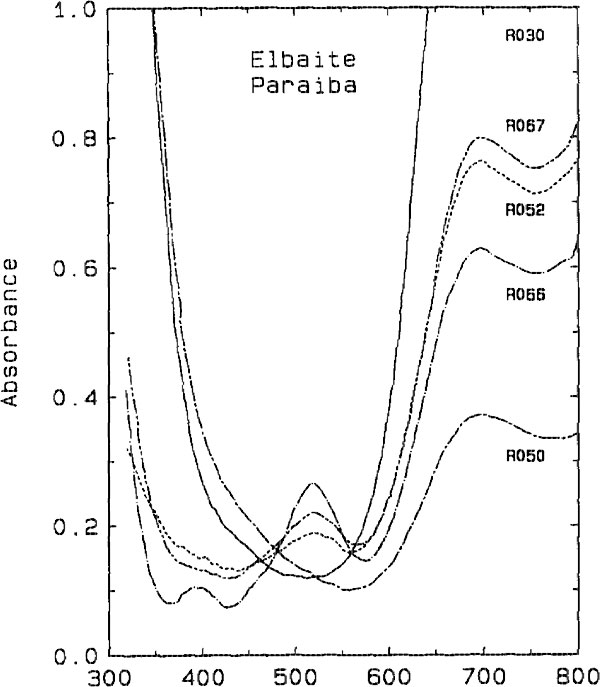
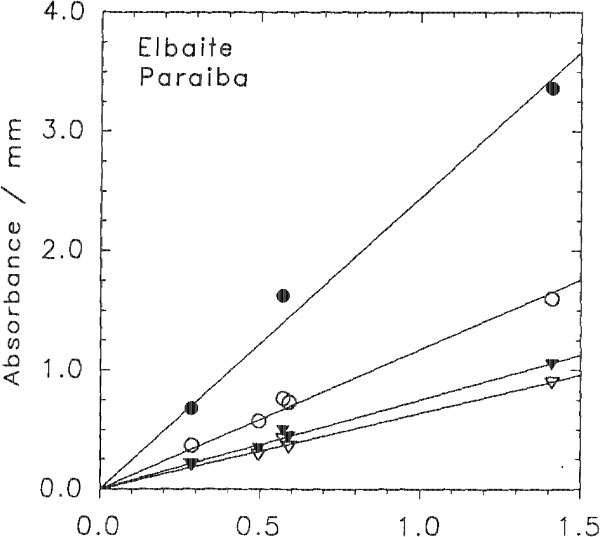
The darker blue to violet specimens display an absorption band centered around 515 nm, attributed to Mn3+ (Manning, 1973). A weak, sharp absorption at about 415 nm, barely visible in Figure 2 but more apparent on spectra obtained from thicker samples, is attributed to Mn2+ (Rossman and Mattson, 1986). Figure 2 presents a comparison of the spectra of a variety of colors of cuprian elbaite from this locality to illustrate how slight differences in absorption spectra are related to differences in color. DISCUSSION We interpret the bands in the 695- to 940-nm regions as arising from absorption by the Cu2+ ion. Figure 3 shows that the two bands in both polarization directions correlate in intensity with the Cu content as determined with the electron microprobe. It is interesting to note that hydrothermally grown synthetic sodium-copper tourmaline spherulites also have a green to blue color (Taylor and Terrell, 1967). Recently, Taran and Lebedev (1990) reported the spectrum of Cu-doped synthetic tourmaline that exhibited the same broad bands at about 695 and 940 nm. This pair of bands observed for the Cu2+ absorption results from the expected Jahn-Teller splitting in a distorted octahedral site (Marfunin, 1979) such as the Y site of elbaite.
The molar absorptivities E can be calculated for each of the Cu2+ bands from the formula absorbance = E x path length x Cu concentration, where the path length is in centimeters and the concentration is in moles per liter. The E values were determined using the average density of the samples and the best linear fit to the experimental points in Figure 3. The resulting values are listed in Table 3. These E values of about 13-50 are higher than the 710 values for Cu2+ in guildite (Wan et al., 1978) and the 4-5 values for Cu2+ in CuSO4 5H2O (Holmes and McClure, 1957). Nevertheless, very little information is available regarding absorption intensity of Cu in materials that are more directly comparable with tourmaline. One should note that the E values of other transition elements often are over 10 in silicates with sites distorted from a regular octahedral coordination (Goldman and Rossman, 1977). CONCLUSIONS Our results indicate that Cu is the principal coloring agent in elbaite from São José de Batalha. The Cu2+ alone is responsible for two strong absorption bands around 695-940 nm, which result in a turquoise blue color. Additional absorption around 515 nm, attributed to Mn2+, produces a shift toward more violet colors (sapphire blue and even violet). A wide absorption centered in the ultraviolet and extending into the visible range, tentatively attributed to Mn2+ - Ti4+ charge transfer, produces a shift toward more greenish colors when combined with the Cu2+ absorptions. Cu concentrations recorded for tourmaline from São José de Batalha are so high that they are significantly above the range of Cu content reported so far in natural elbaite (Staatz et al., 1955; Dietrich, 1985; and experience of the authors). Therefore, if a Cu content greater than 0.1 wt% Cu can be detected in a gem-quality elbaite, this provides proof at this time that the tourmaline comes from São José de Batalha.
Fig. 2. Comparison of the spectra of cuprian elbaite from Paraíba, Brazil
showing the minor differences in the visible region which are responsible for
the color differences among the samples. All spectra are plotted normalized to
1.0 mm thick samples. (top) E || c polarization. (bottom) E
Fig. 3. Correlations between the intensity of absorption bands in elbaite from Paraiba, Brazil, and the Cu content determined by electron microprobe analysis. The lines are linear fits to the data constrained to pass through the origin. Solid circles = 905 nm; open circles = 695 nm; solid triangles = 940 nm; open triangles = 740 nm.
TABLE 3. Spectroscopic data for Cu2+ in cuprian elbaite
We believe that the Cu concentration found in these Paraíba tourmalines is among the highest reported in silicate minerals that otherwise do not contain Cu as a major constituent. This raises the question of why Cu occurs in these gem-quality tourmalines, since this element is not often concentrated in silicates. Furthermore, Cu concentration in a granitic pegmatite environment is also unusual. In absence of additional information on the mineral assemblage of this pegmatite, one can only hypothesize that tourmaline may have provided the most favorable site for Cu incorporation. ACKNOWLEDGMENTS The authors wish to thank Gerhard Becker, Friedrich August Becker Edelsteinschleiferei, Idar-Oberstein, Germany, and Brian Cook, Nature's Geometry, Graton, California, for providing samples and information on the deposit shortly after its discovery. David Stanley Epstein, Precious Resources Ltda., Teófilo Otoni, Brazil, provided useful information on the deposit, and Rock Currier from Monrovia, California, provided additional study material from this locality. Preliminary spectroscopic investigations were done by Mike Moon and Meredith Mercer, and the optical properties were measured by John I. Koivula and Christopher P. Smith, all from the Gemological Institute of America (GIA) or the GIA Gem Trade Laboratory, Santa Monica, California. X-ray crystal alignments were performed by William P. Schaeffer, and electron microprobe analyses were obtained by Paul Carpenter and John Armstrong, all with the California Institute of Technology, Pasadena, California. X-ray powder patterns were obtained by Waldo Winterbum, Center for Materials Research, Stanford University, Stanford, California. REFERENCES CITED Armstrong, J. T. (1982) New ZAF and α-factor correction procedures for the quantitative analysis of individual microparticles. In K.F.J. Heinrich, Ed., Microbeam analysis- 1982, p. 175-180. San Francisco Press, San Francisco. __________ (1988) Quantitative analysis of silicate and oxide materials: Comparison of Monte Carlo, ZAF and o(z) procedures. In D.E. Newbury, Ed., Microbeam analysis- 1988, p. 239-246. San Francisco Press, San Francisco. Bank, H., Henn, U., Bank, F.H., v. Platen, H., and Hofmeister, W. (1990) Leuchtendblaue Cu-führende Turmaline aus Paraiba, Brasilien. Zeitschrift der Deutschen Gemmologischen Gesellschaft, 39-1, 3-11. Carobbi, G., and Pieruccini, R. (1946) Analisi spettrograflca delle tormaline elbane-Relazione fra colore e composizione. Ricerca Scientiflca e Riconstruzione, 16-10, 1466-1467. ________ (1947) Spectrographic analysis of tourmalines from the Island of Elba with correlation of color and composition. American Mineralogist, 32, 121-130. Correns, C.W. (1969) Introduction of mineralogy, crystallography and petrology (2nd edition), 484 p. Springer-Verlag, New York. Deer, W.A., Howie, R.A., and Zussman, J. (1986) Rock-forming minerals, vol. III: Disilicates and ring silicates. Longman, Harlow, United Kingdom. Dietrich, R.V. (1985) The tourmaline group. Van Nostrand Reinhold, New York. Fritsch, E., Shigley, J.E., Rossman, G.R., Mercer, M.E., Muhlmeister, S.M., and Moon, M. (1990) Gem-quality cuprian elbaite tourmalines from São José de Batalha, Paraíba, Brazil. Gems and Gemology, 26, 189-205. Gebert, W., and Zemann, J. (1965) Messung der Ultrarot-pleochroismus von Mineralen, II. Der Pleochroismus der OH-Streckfrequenz in Turmalin. Neues Jahrbuch für Mineralogie Monatshefte, 1965, 232-235. Goldman, D.F., and Rossman, G.R. (1977) The identification of Fe2+ in the M4 site of calcic amphiboles. American Mineralogist, 62,205-216. Holmes, O.G., and McClure, D.S. (1957) Optical spectra of hydrated ions of the transition metals. Journal of Chemical Physics, 26, 1686-1694. Kelly, K.L., and Judd, D.B. (1976) Color: Universal language and dictionary of names. National Bureau of Standards Special Publication 440, 158 p. Koivula, J.I., and Kammerling, R.C. (1989) Gem news: Paraíba tourmaline update. Gems and Gemology, 25-4, 248. Love, G., Cox, M.G., and Scott, V.D. (1978) A versatile atomic number correction for electron-probe microanalysis. Journal of Physics D, 11, 7-27. Manning, P.G. (1973) Effect of second nearest neighbor interaction of Mn3+ absorption in pink and black tourmaline. Canadian Mineralogist, 11,971-977. Marfunin, A.S. (1979) Physics of minerals and inorganic materials, 340 p. Springer-Verlag, Berlin. Mattson, S.M., and Rossman, G.R. (1987) Fe2+-Fe3+ interactions in tourmaline. Physics and Chemistry of Minerals, 14, 163-171. Munsell book of color (1979) Matte finish collection. Munsell Color, Macbeth Division of Kollmorgen Corp., Baltimore, Maryland. Reed, SJ.B. (1965) Characteristic fluorescence correction in electron-probe microanalysis. British Journal of Applied Physics, 16, 913-926. Rossman, G.R., and Mattson, S.M. (1986) Yellow, Mn-rich elbaite with Mn-Ti intervalence charge transfer. American Mineralogist, 71, 599602. Schmetzer, K., and Bank, H. (1979) East African tourmalines and their nomenclature. Journal of Gemmology, 16-5, 310-311. Staatz, M.H., Murata, K.J., and Glass, J.J. (1955) Variation of composition and physical properties of tourmaline with its position in the pegmatite. American Mineralogist, 40, 789-804. Taran, M.N., and Lebedev, A.S. (1990) Optical absorption spectra of synthetic tourmalines. International Mineralogical Association Abstract with Program, 457-458. Taylor, A.M., and Terrell, B.C. (1967) Synthetic tourmalines containing elements of the first transition series. Journal of Crystal Growth, 1, 238-244. Wan, C., Ghose, S., and Rossman G.R. (1978) Guildite, a layer structure with a ferric hydroxyl-sulphate chain and its optical absorption spectra. American Mineralogist, 63, 478-483. Warner, T.W. (1935) Spectrographic analysis of tourmalines with correlation of color and composition. American Mineralogist, 20, 531-536. Wickersheim, K.A., and Buchanan, R.A. (1959) The near infrared spectrum of beryl. American Mineralogist, 44, 440-445. __________ (1968) The near infrared spectrum of beryl: A correction. American Mineralogist, 53, 347. MANUSCRIPT RECEIVED JULY 16, 1990 MANUSCRIPT ACCEPTED MAY 21, 1991
| |||||||||||||||||||